Document Comparison Chart
- Another interesting visual that is in a way similar to document portrait is the Document Comparison Chart, which compares the coding in multiple documents instead of just one.
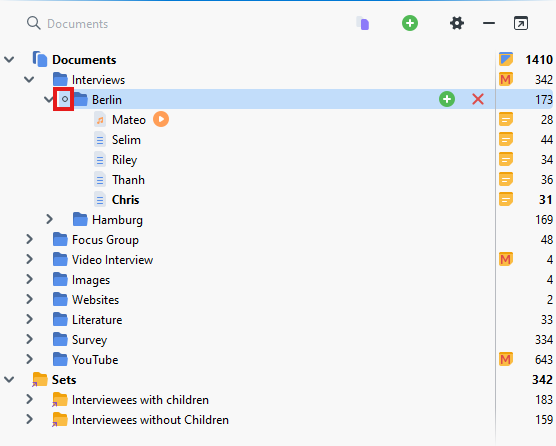
First, I’m going to activate all the Interviews from Berlin to compare them, by clicking on the circle to the left of the Berlin folder. This activates everything in the folder.
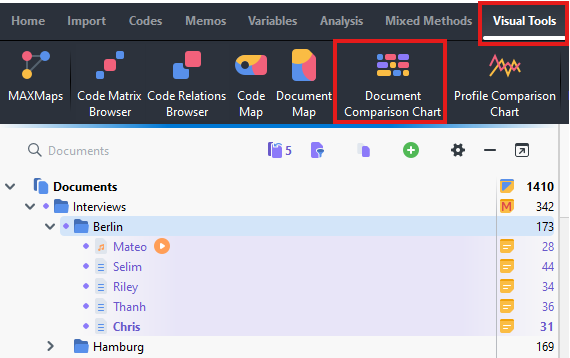
- Next, go to the Visual Tools menu and select Document Comparison Chart.
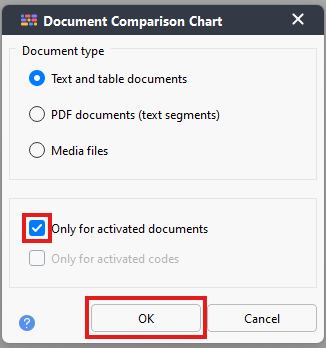
Make sure that Only for activated documents is checked, then click on OK.
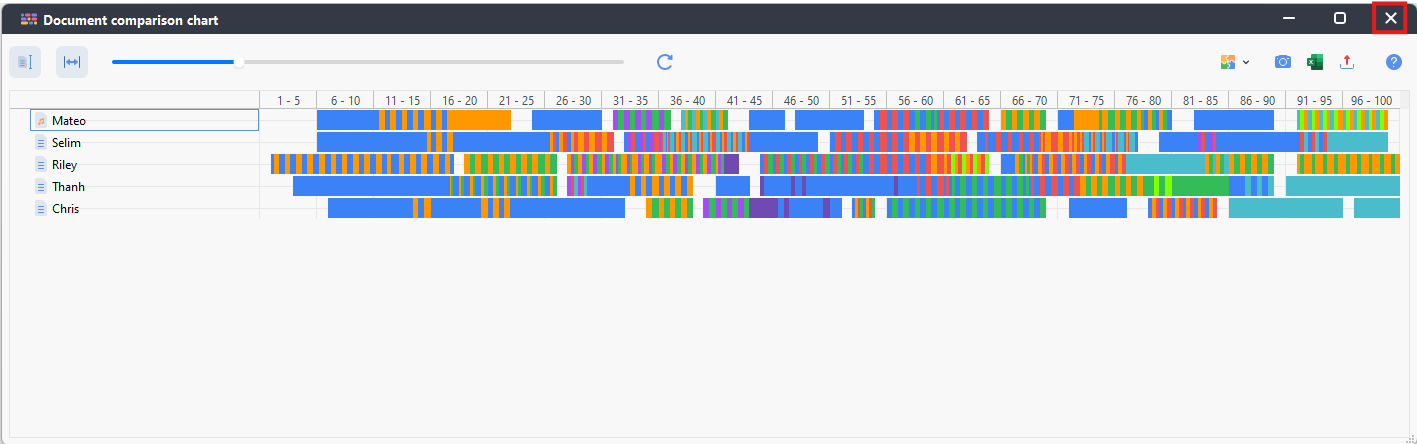
- This visual allows you to compare essentially Document Portraits for different documents. This works particularly well for structured documents that have the same number of paragraphs and allow for a direct comparison. Click on the icon at the top left to standardize the document lengths to help with comparisons.
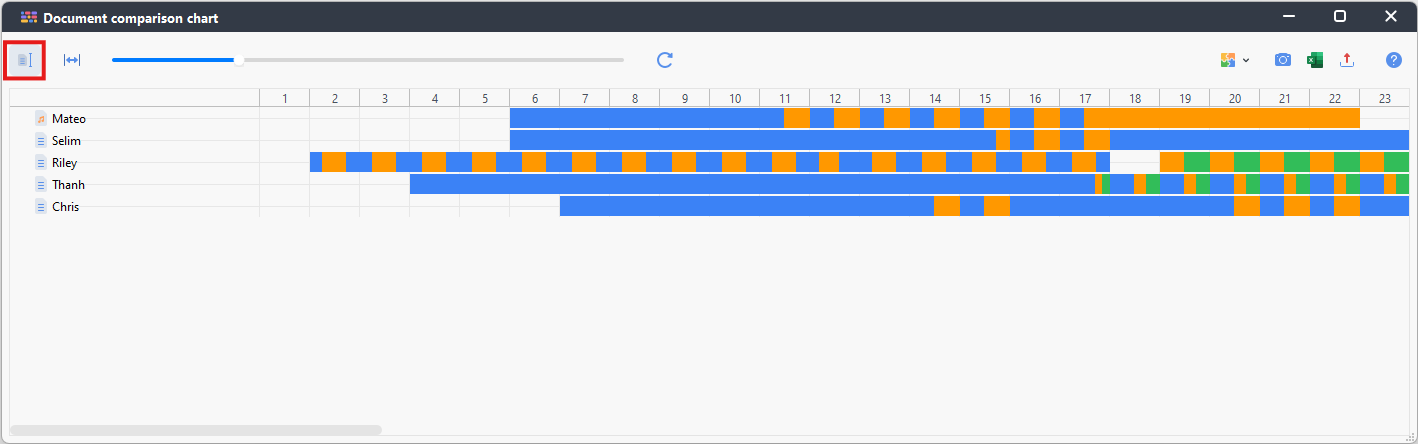
- You can also click on the icon to the right of that, to fit the display to the window to see the whole visual at a glance, without needing to scroll.
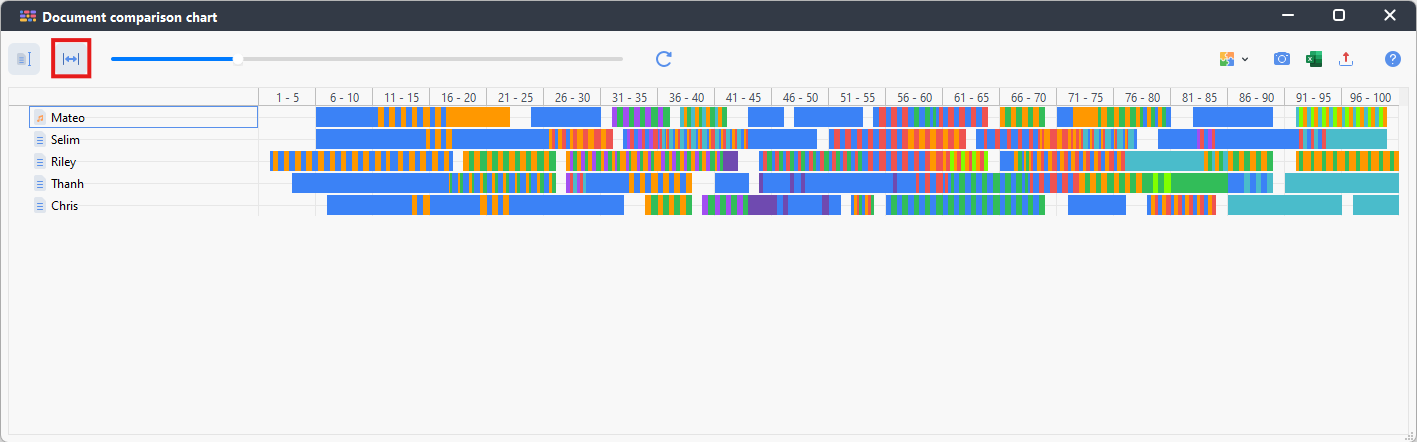
- Again, we can export this, if we wanted. Look at the differences, for example, in how much negative or positive coding there is compared to each document or where in the interviews do most people start getting negative. For now, let’s close the window.
Technique: Qualitative Data Analysis | Tools: MAXQDA