Survey Data
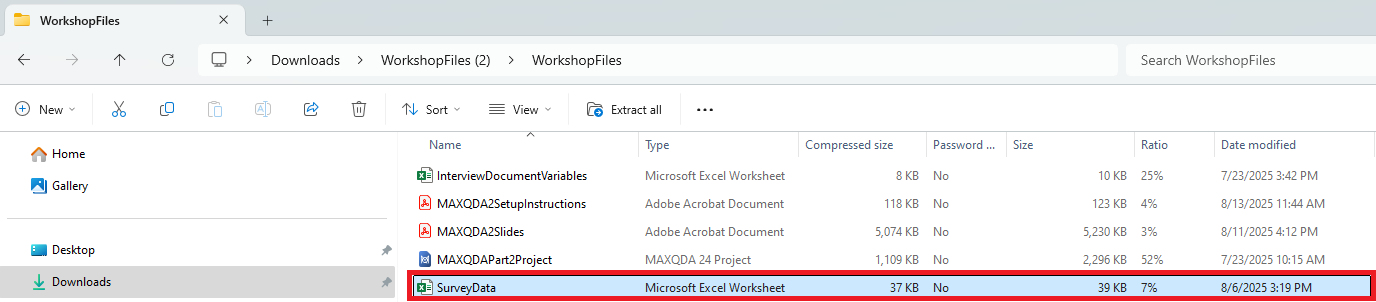
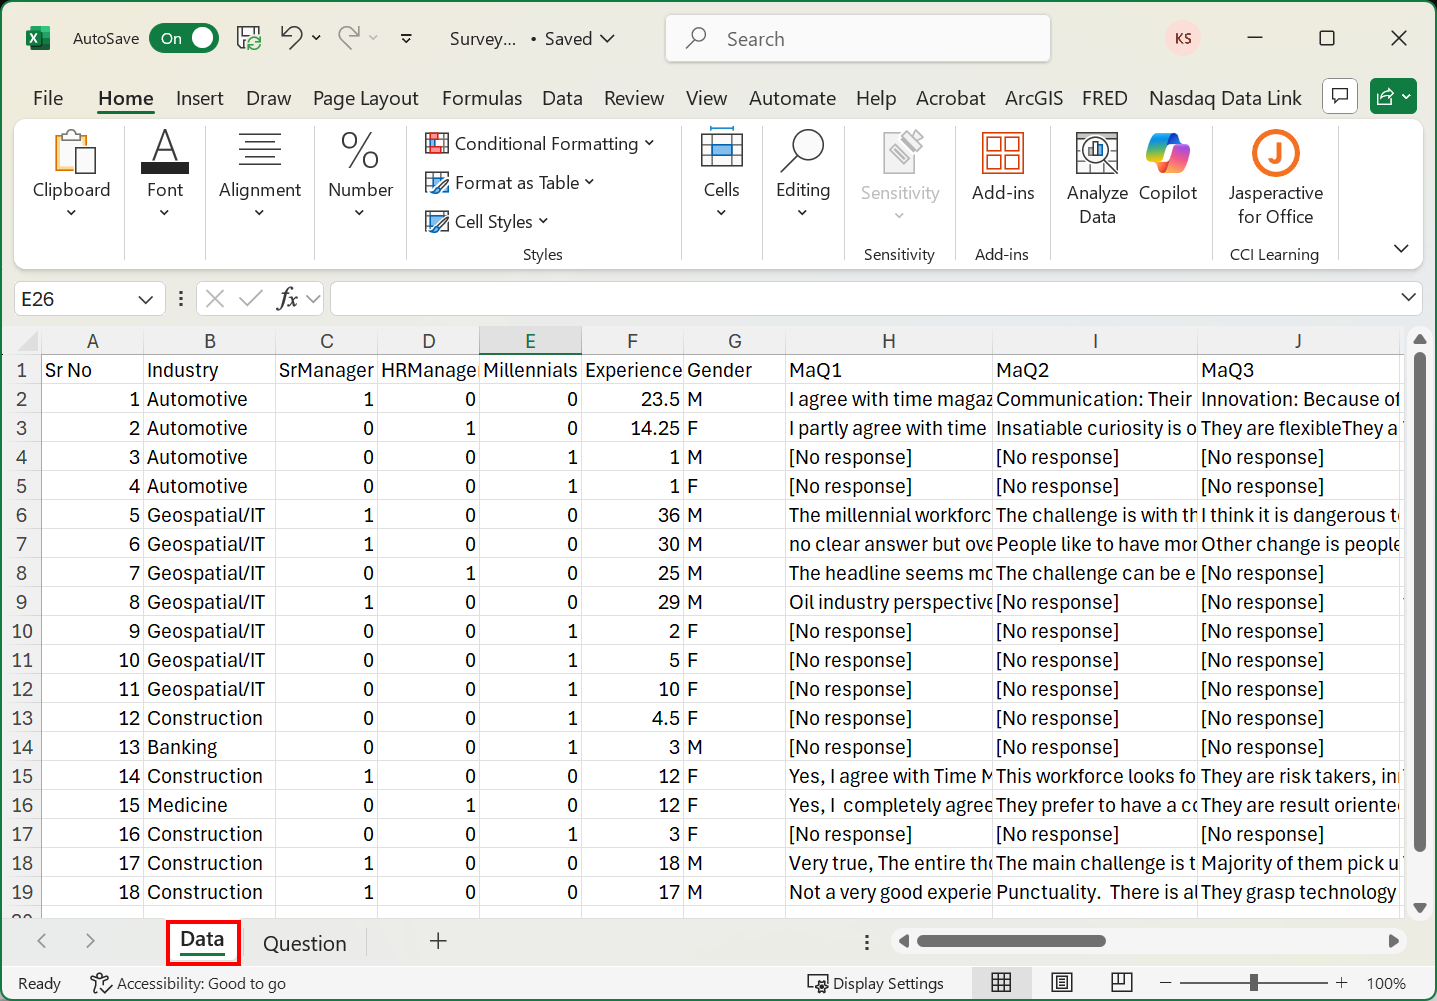
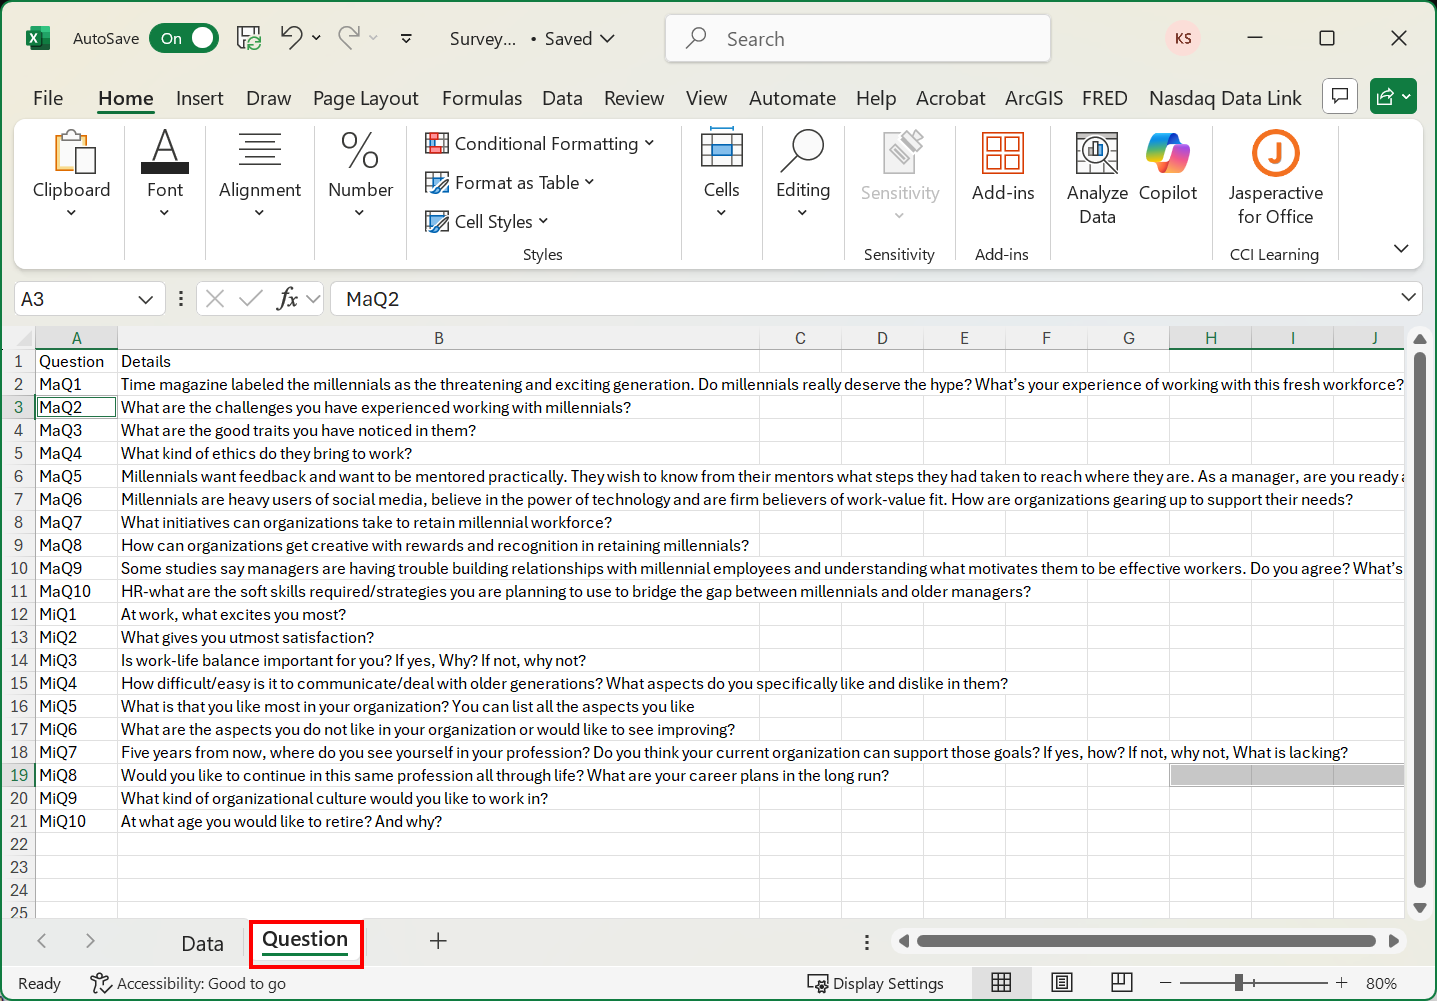
The second special data type we’re going to look at is Survey data. As part of the download package, I provided you with an Excel file called SurveyData.xlsx. This is a Survey of Millennials on their thoughts about work from a database called Kaggle. Let’s open it up and take a look. You’ll see that in the data tab, each row is a participant with their responses. Each column is a code that corresponds with a question in the survey. To see how the codes and questions match up, you can look at the questions tab.
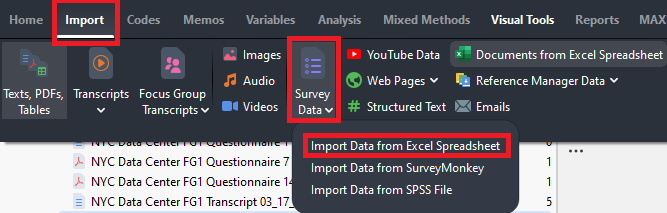
Okay, let’s import this Excel file in. Close Excel and go back to MAXQDA. Highlight the Documents folder. Then go to the Import menu and select Survey Data. You’ll see that you are able to import survey data from Excel, Survey Monkey, and SPSS. For us, we need to select Import Data from Excel Spreadsheet.
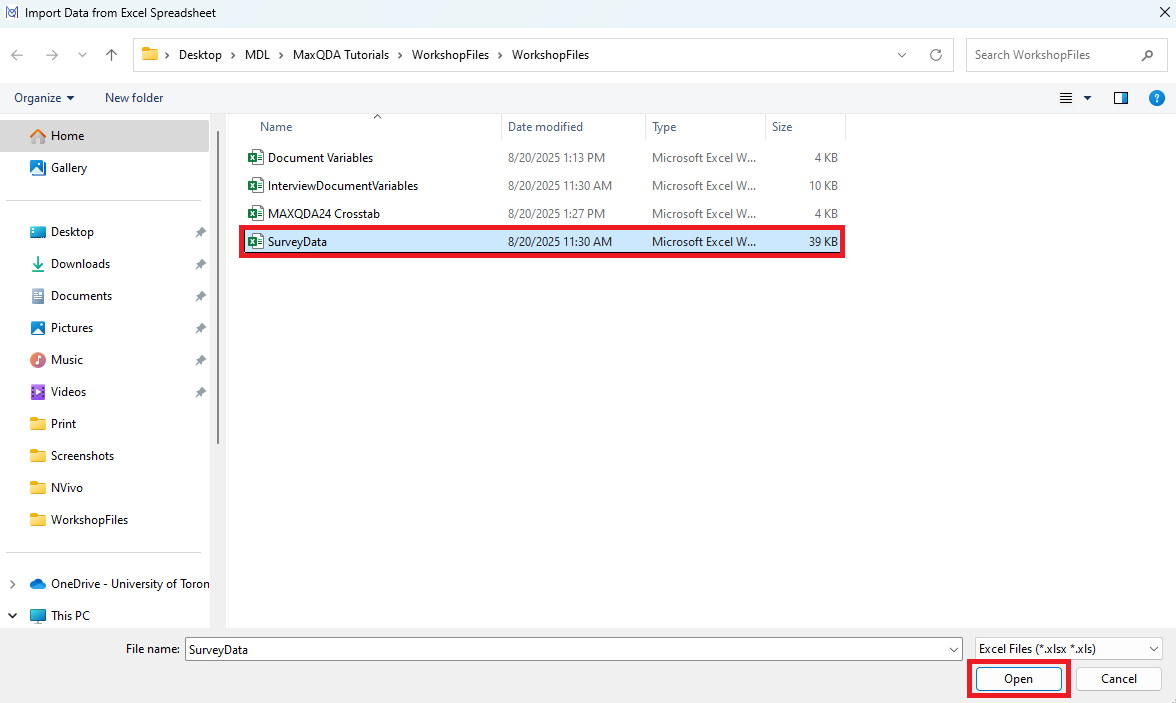
- Browse to the SurveyData excel file and click on Open.
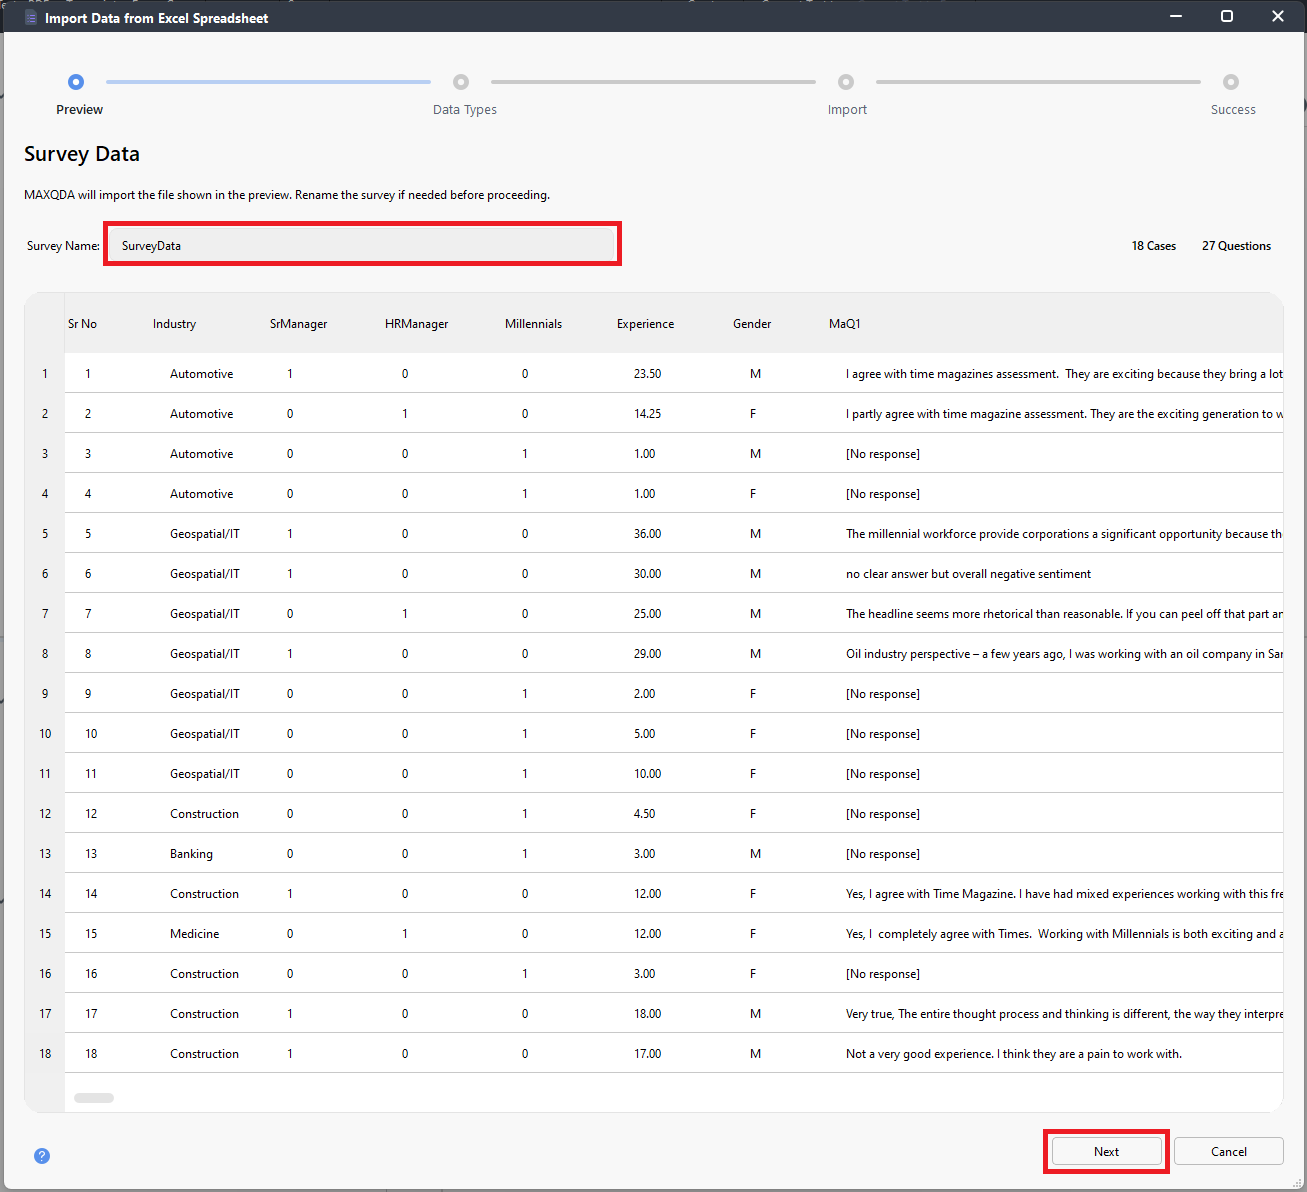
- The first screen just asks you to rename the survey, if needed, before proceeding. That name will be the name of the document group that will store all the survey responses. It also provides a preview of the data. We can keep the name as is, then click on Next.
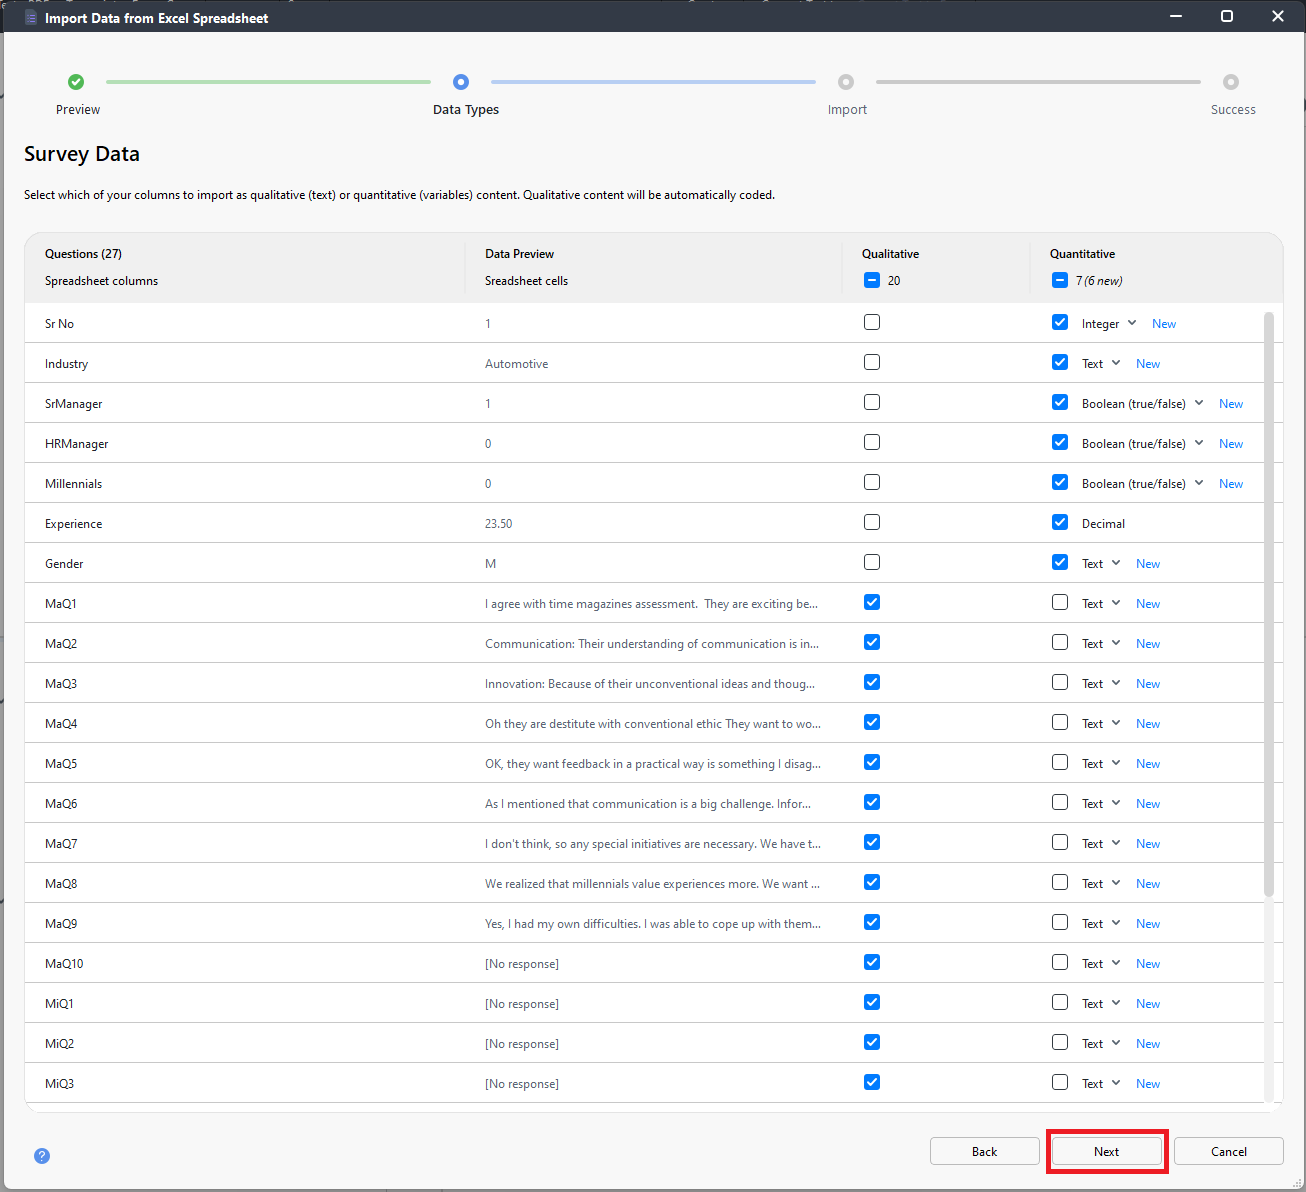
- You then have to go through and identify which questions are closed-ended questions (those questions should have quantitative selected), and which questions are open-ended questions (those questions should have qualitative selected). Unfortunately, you may need to do this manually if it has issues detecting the questions correctly, such as in our situation. In our case, the first few questions are all closed ended. All the rest are open-ended questions, starting with the MaQ1 to the end. To select them quickly, you can use the toggle boxes for qualitative and quantitative. First click on the boxes beneath qualitative and quantitative until all check boxes are cleared. Then click on the box beneath qualitative to select qualitative for all items. Then manually deselect qualitative for the closed-ended questions and instead select quantitative. When you’re done you should have quantitative selected for the closed-ended questions and qualitative selected for the open-ended questions. For the quantitative variables, it also detects the type of data, Boolean, text, etc. Make sure that these are also correct. In our case, it all looks good, so click on Next.
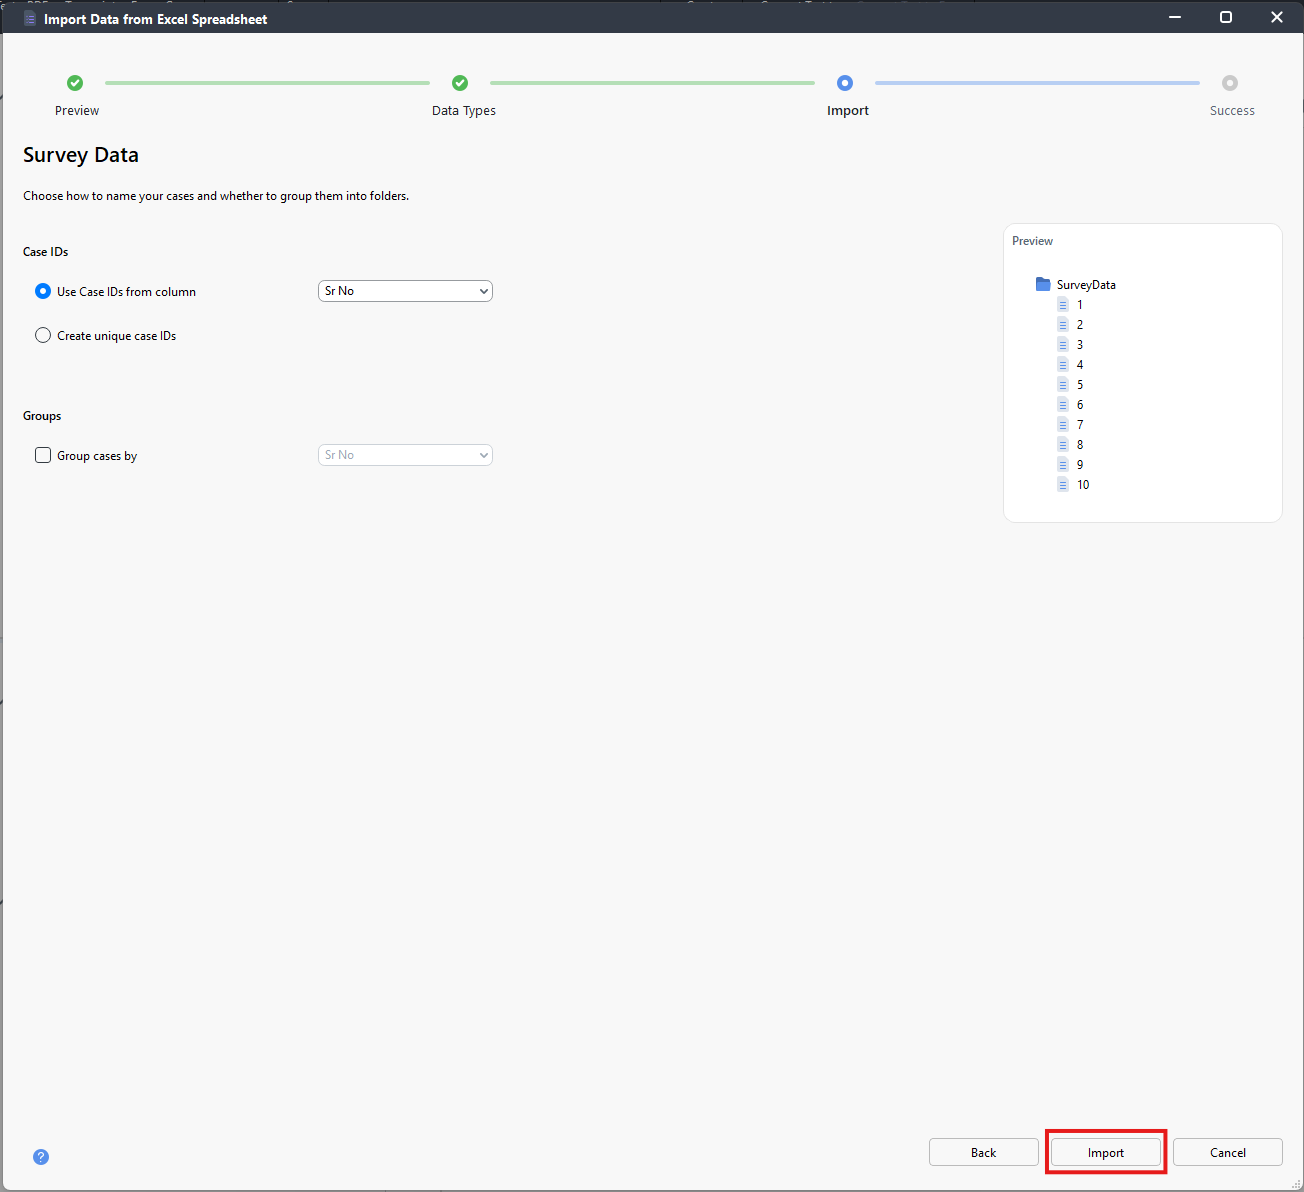
- The next screen asks how to name your cases and whether to group them into folders. We can use the column Sr No as our Case IDs, which should be selected automatically. We don’t want any grouping, so we can leave that blank. Finally, we can click on Import.
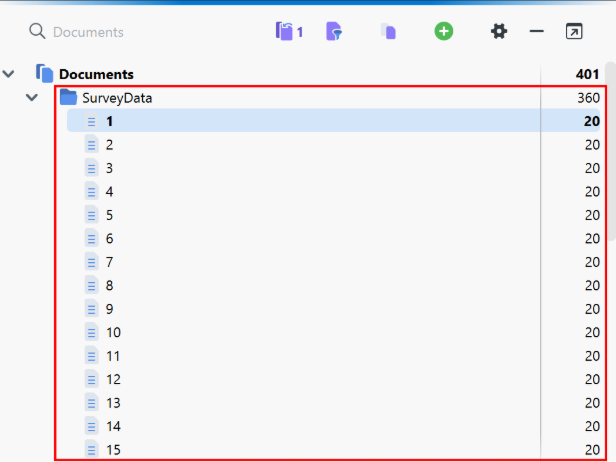
A window will pop-up to tell you that the survey imported successfully. You should have one document for each survey respondent, all grouped together in a New Document Group, SurveyData. Each document lists all the open-ended question responses for that survey respondent. For now, we can click on OK.
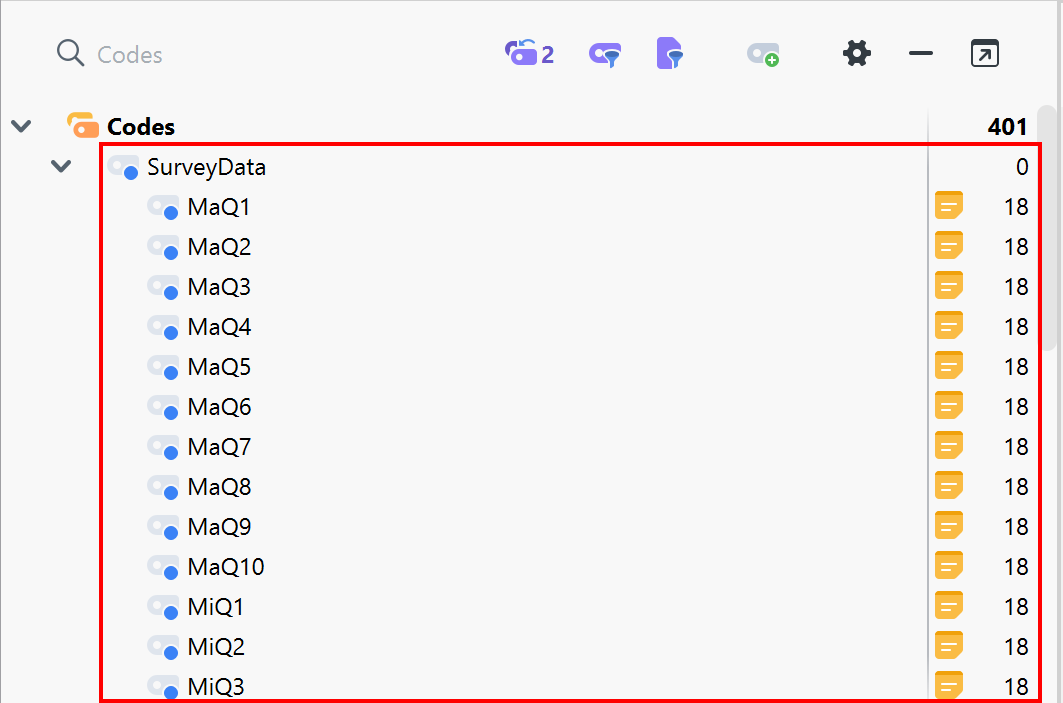
Along with creating documents, it also creates a code for each survey open-ended question’s responses, under a Parent Code, which is the same name as the document group, in this case, SurveyData.
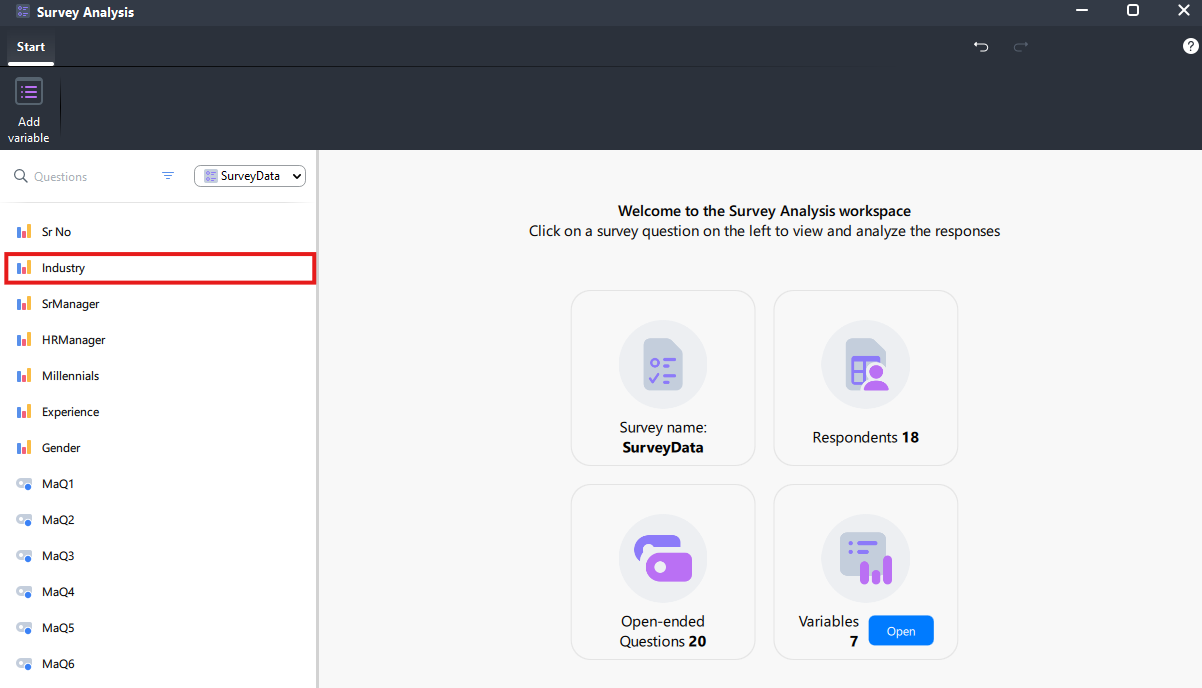
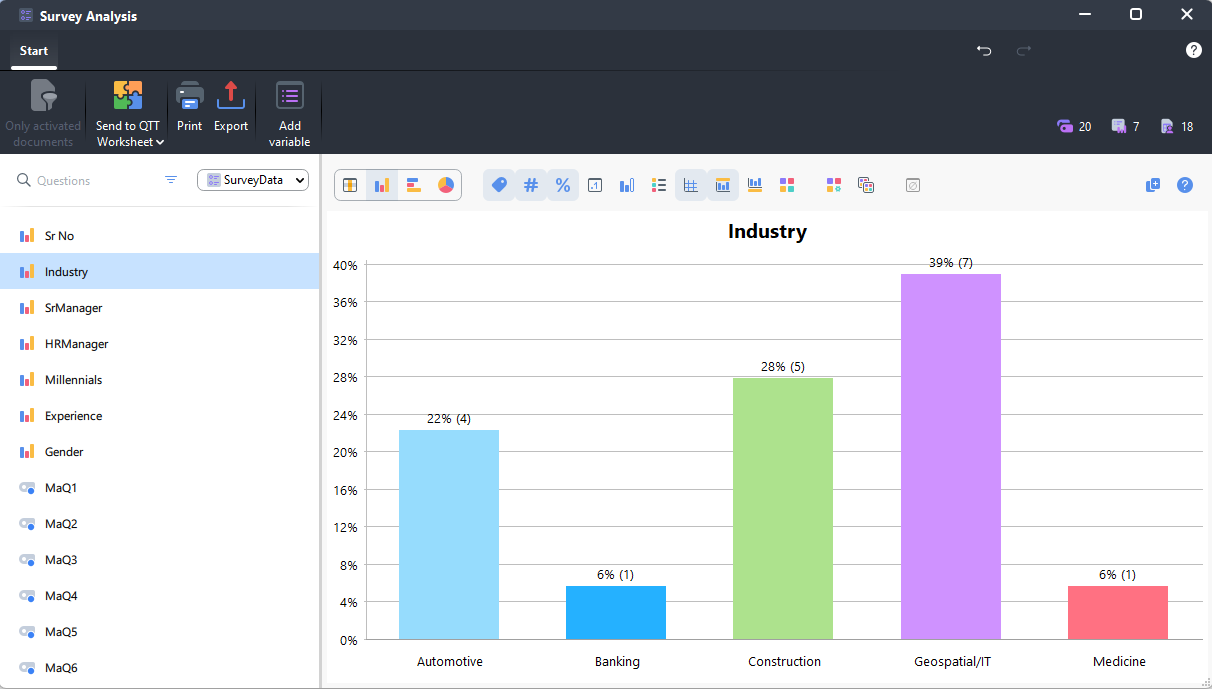
Another window should also open up automatically, which is the Survey Analysis window. On the left, it lists our survey questions. If you click on a closed-ended question, such as Industry, it will display a bar graph of the various responses to this question.
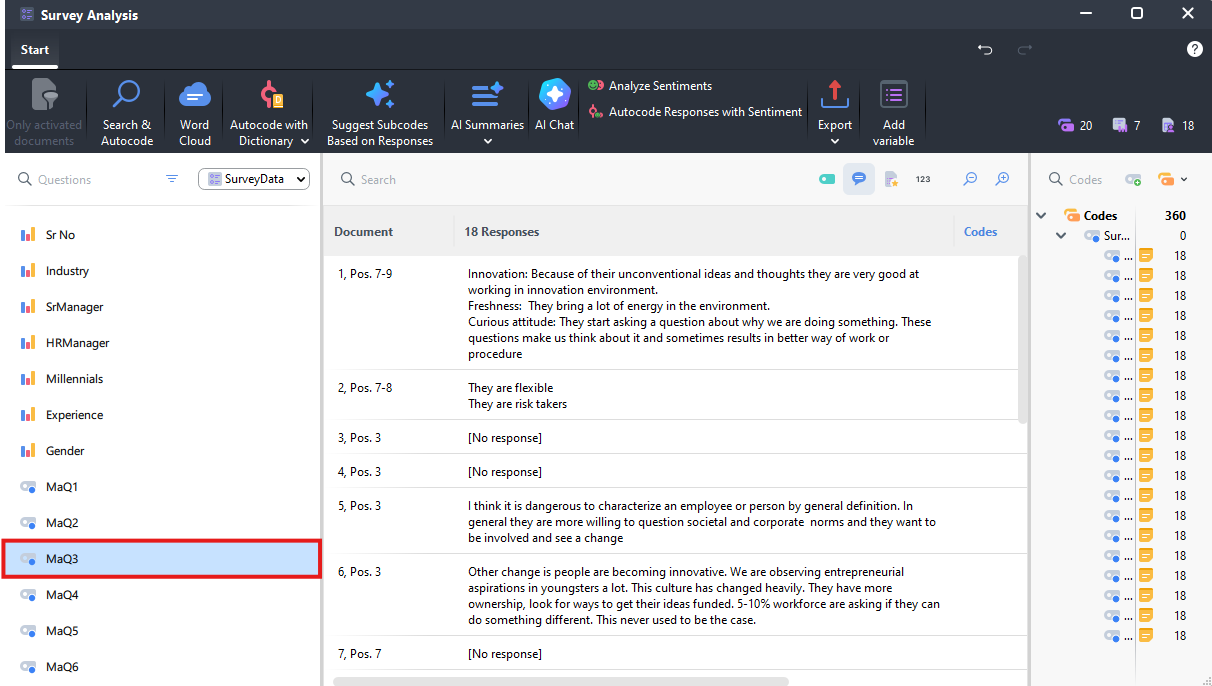
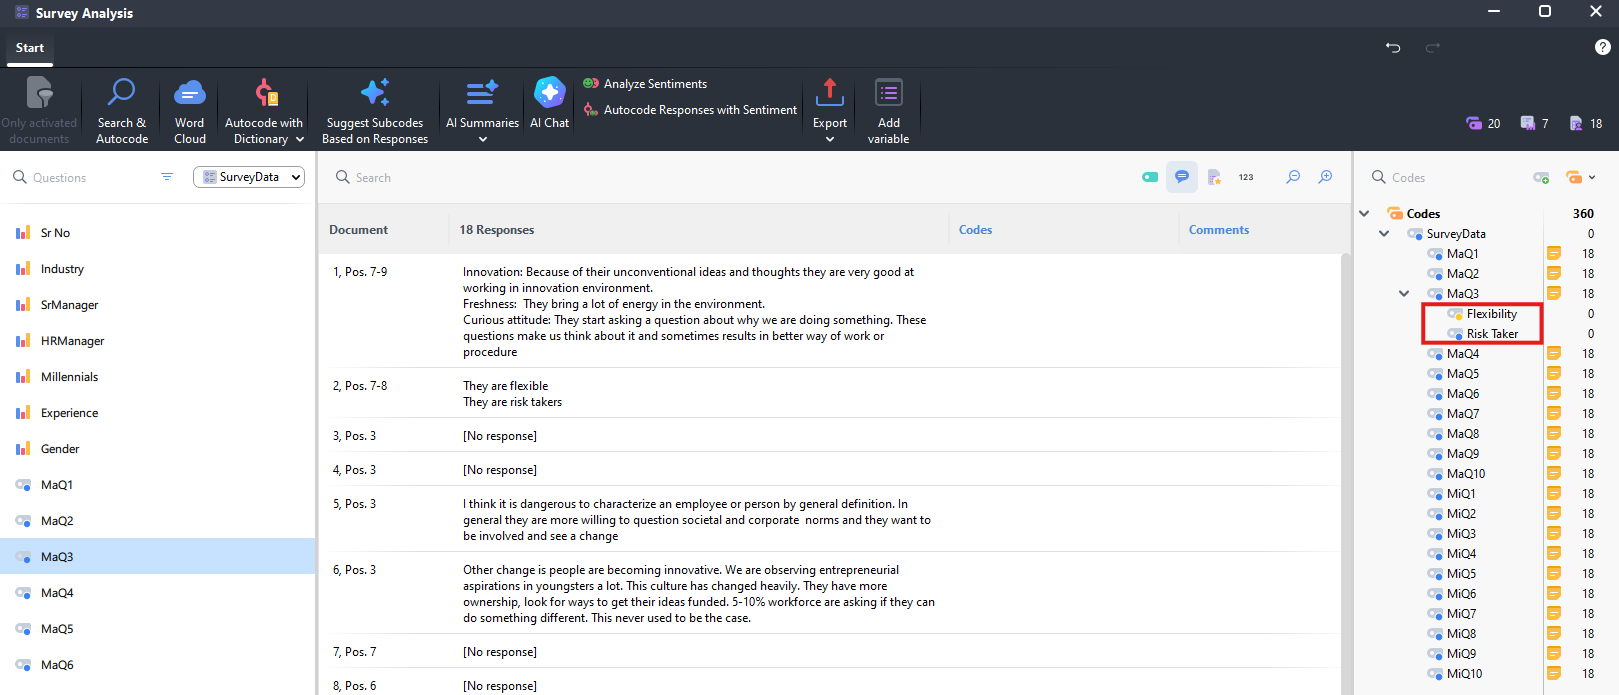
- If you click on an open-ended question on the left, it will display the responses in the centre panel to that question, and on the right, it will display the new code system for our questions. For example, click on MaQ3.
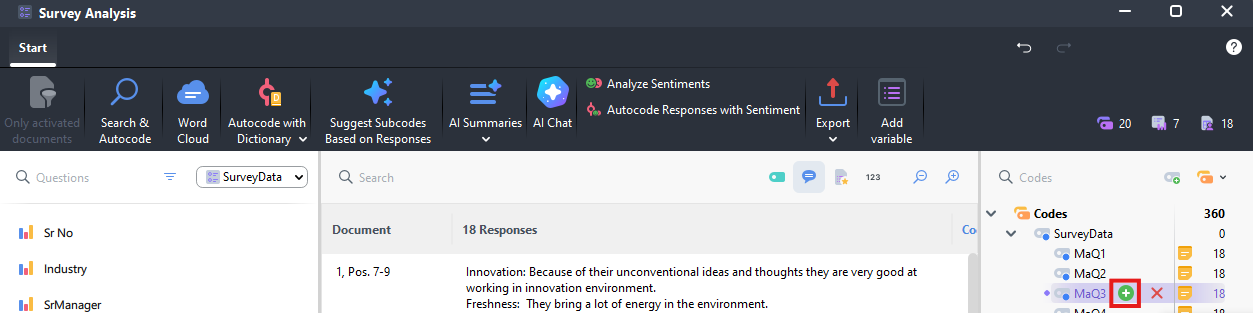
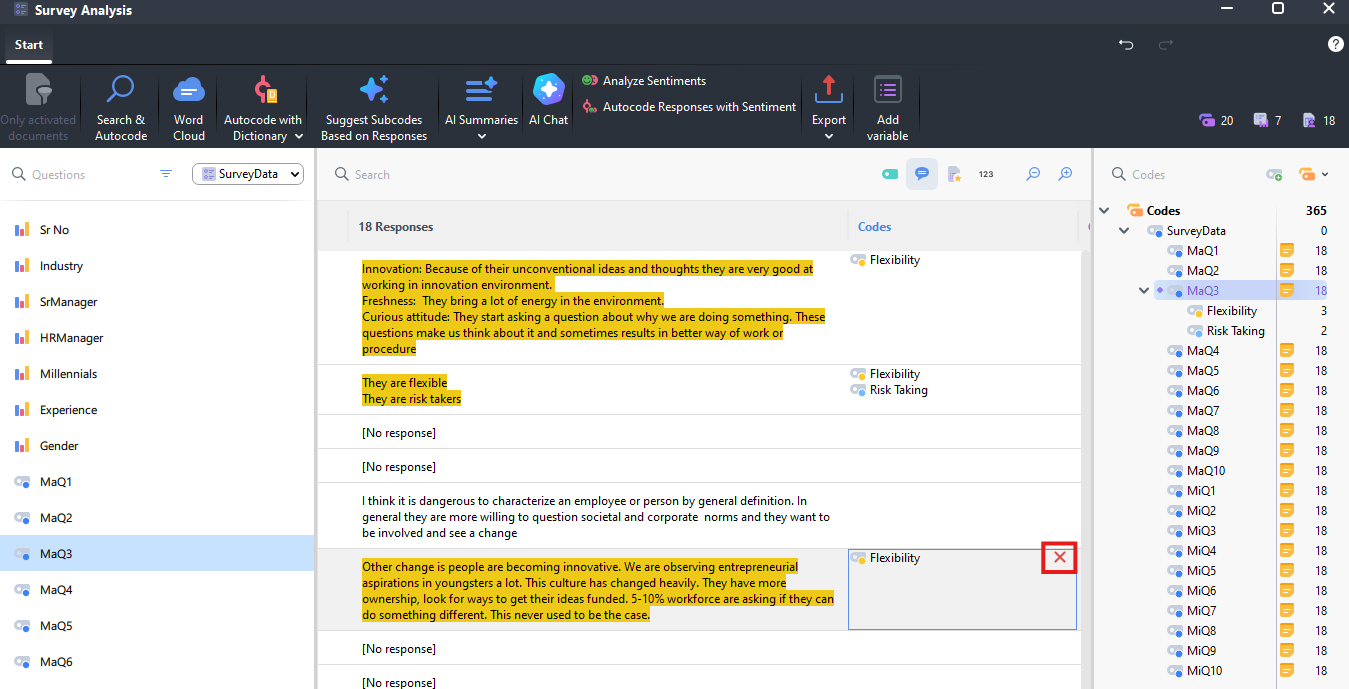
Now we can use the code system on the right to create new codes we can use to code our data. For example, if you hover over MaQ3 parent code, click on the green plus sign and create a new subcode called Flexibility. Do that one more time to create another subcode called Risk Taking. Then try coding some of the responses to those codes. You can now see the codes listed to the right of the responses in the centre panel. If you hover over a code there, you can click on the X to remove that code being applied to that response if you make a mistake.
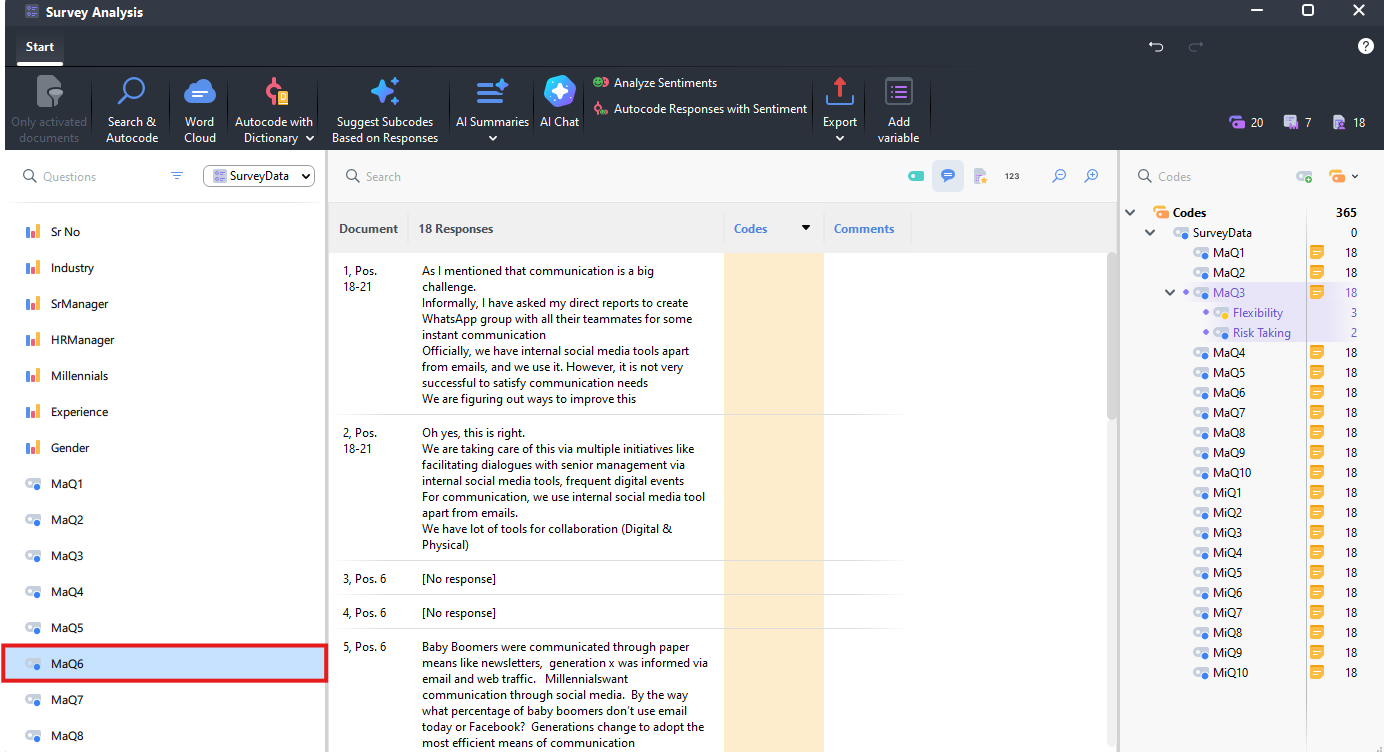
You can also do a text and search autocode as we’ve done with other documents. Select question MaQ6 on the left.
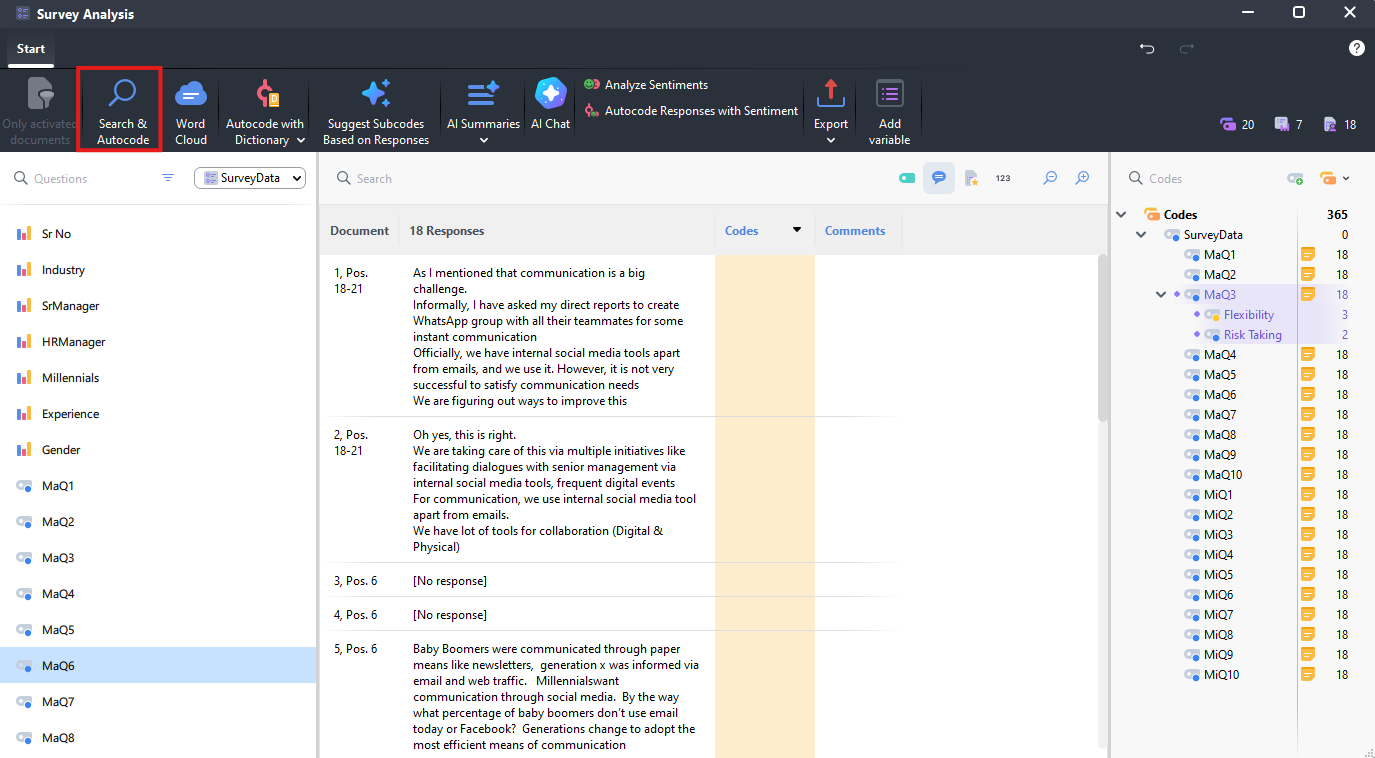
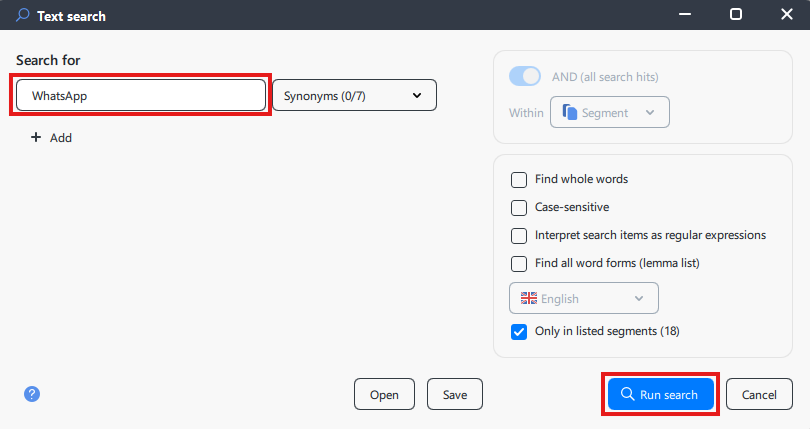
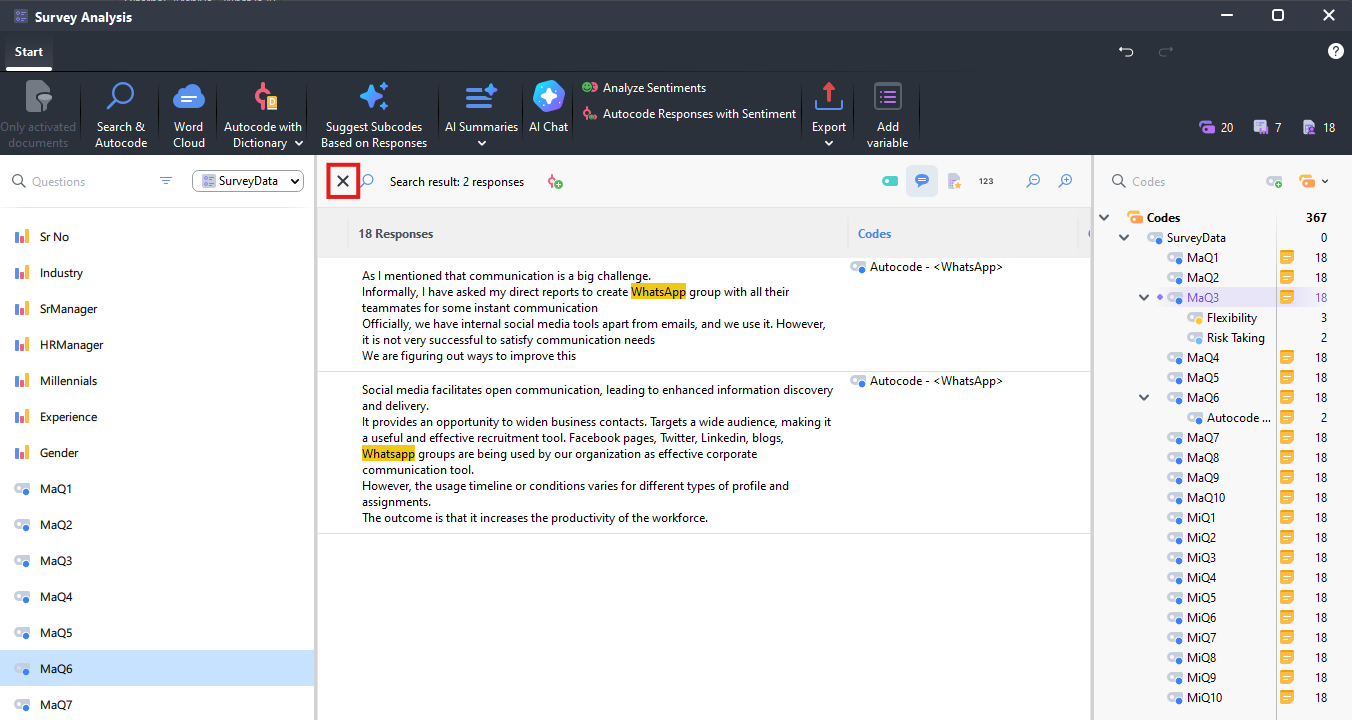
Click on search Search & Autocode, search for WhatsApp, and click on Run search.
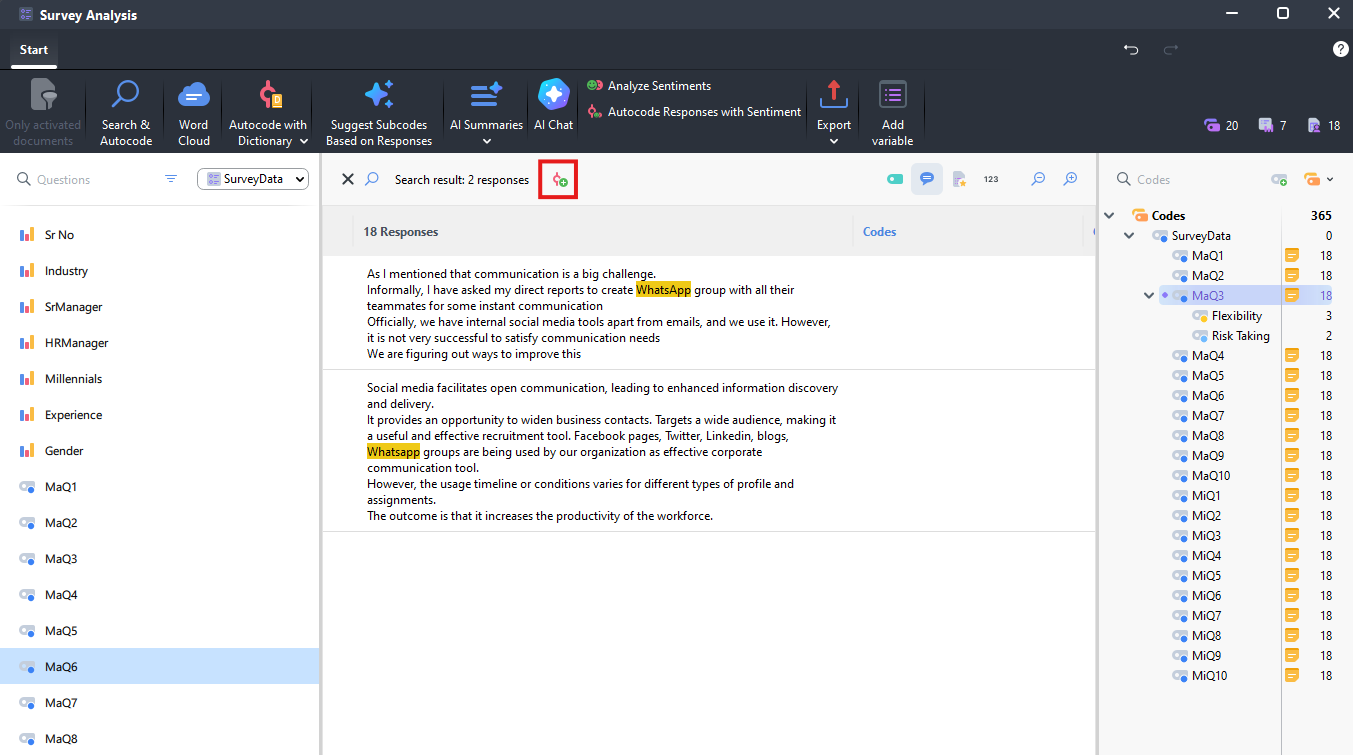
You should have two results. You can create a new code and code these items by clicking on the coding icon just above the responses (looks like a red circle with a green plus sign).
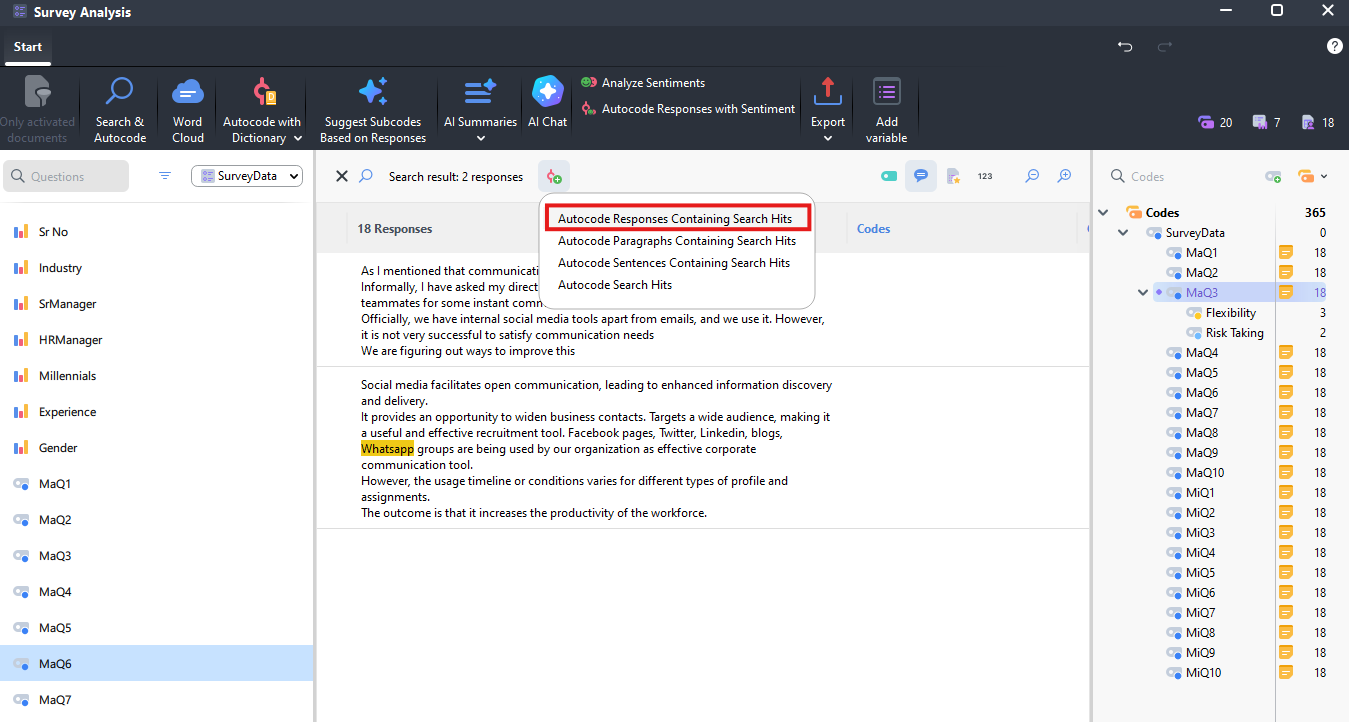
- You can choose to code entire responses, paragraphs, sentences, or just the search hit. In our case, let’s code responses (as the responses are short). Select Autocode Responses Containing Search Hits.
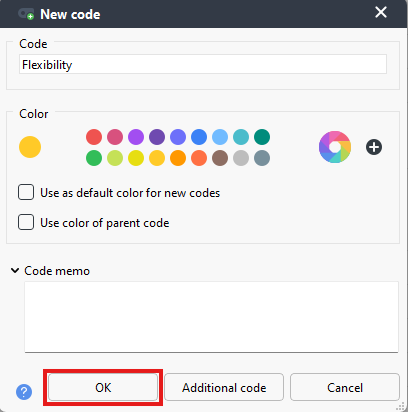
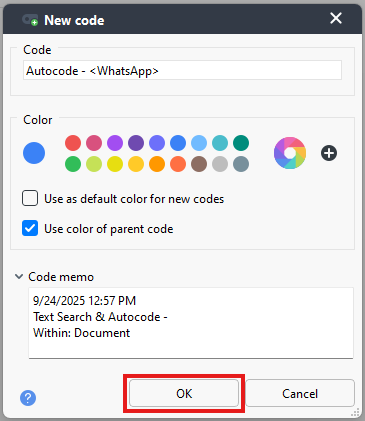
- A new code pop-up window should appear. Click on OK to keep the defaults.
- Now your responses are coded with the new code. Click on the X above the search results to go back to seeing all the responses for this question.
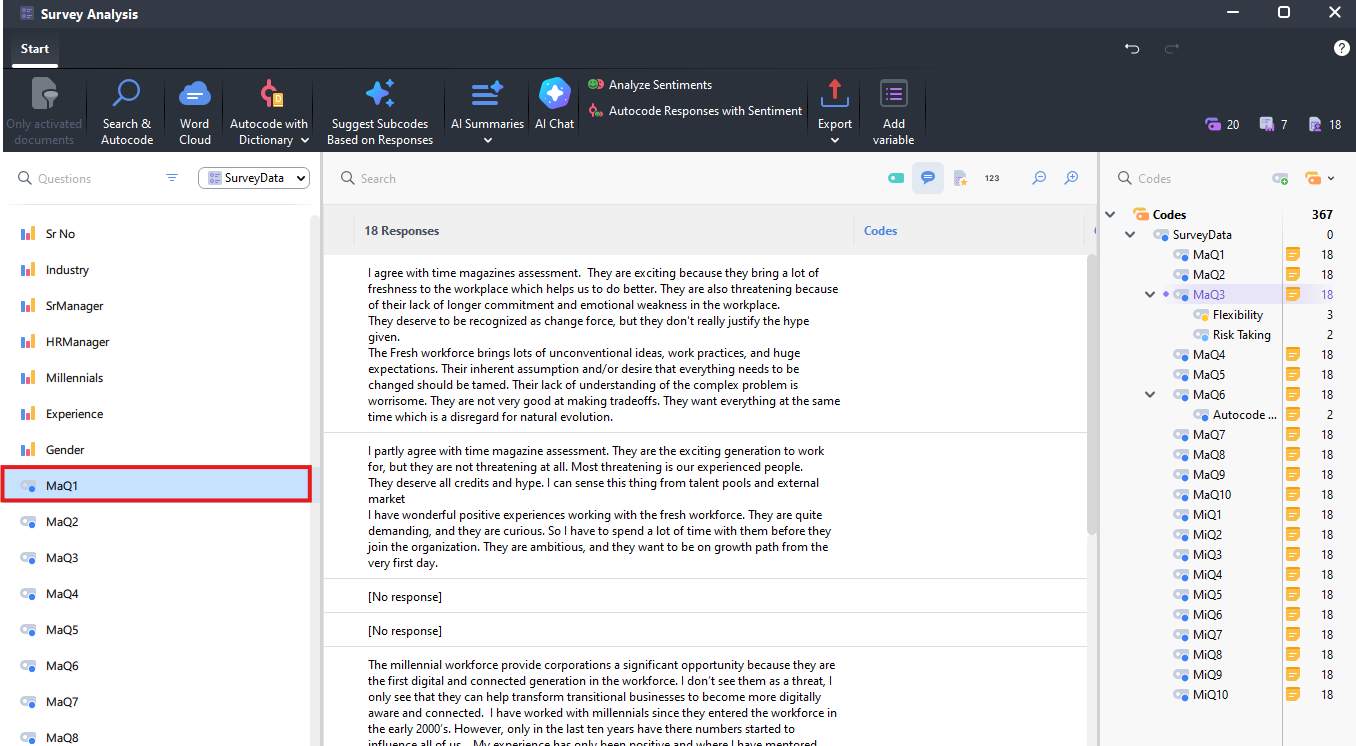
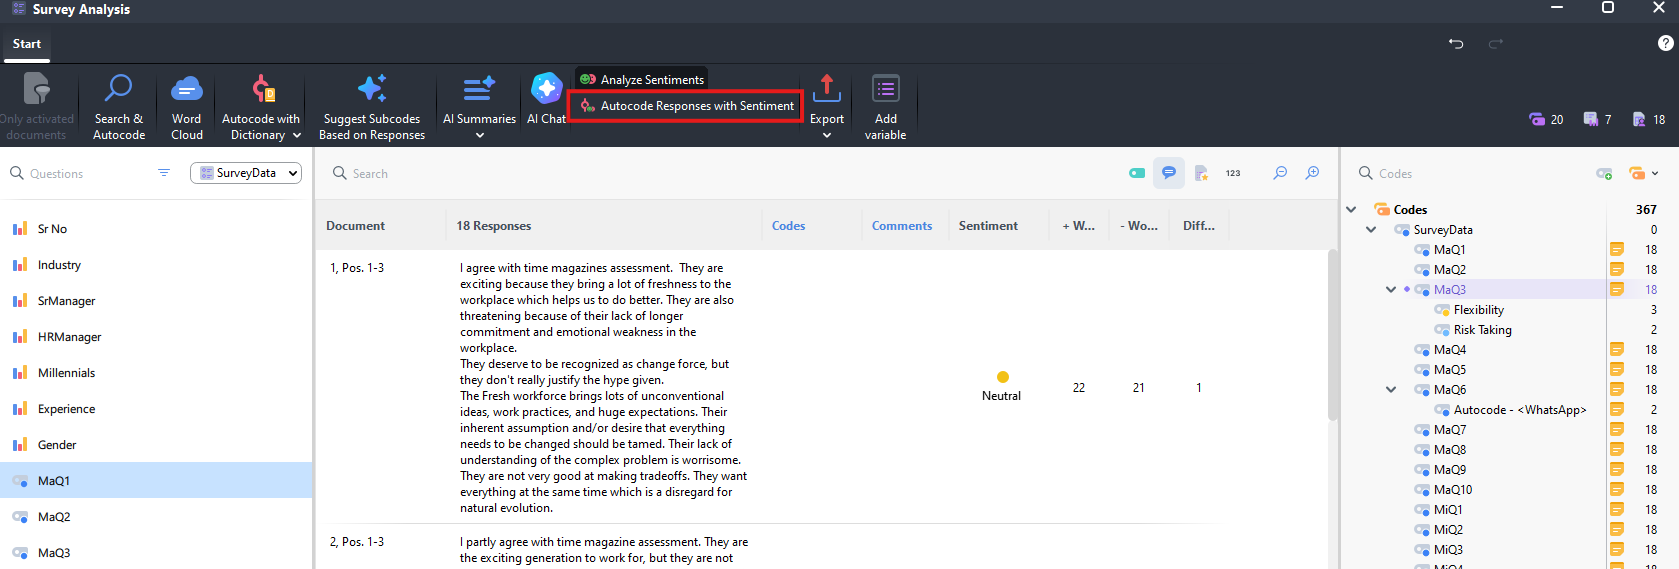
- Finally, we can use a tool to analyze sentiment of responses. Select MaQ1 on the left.
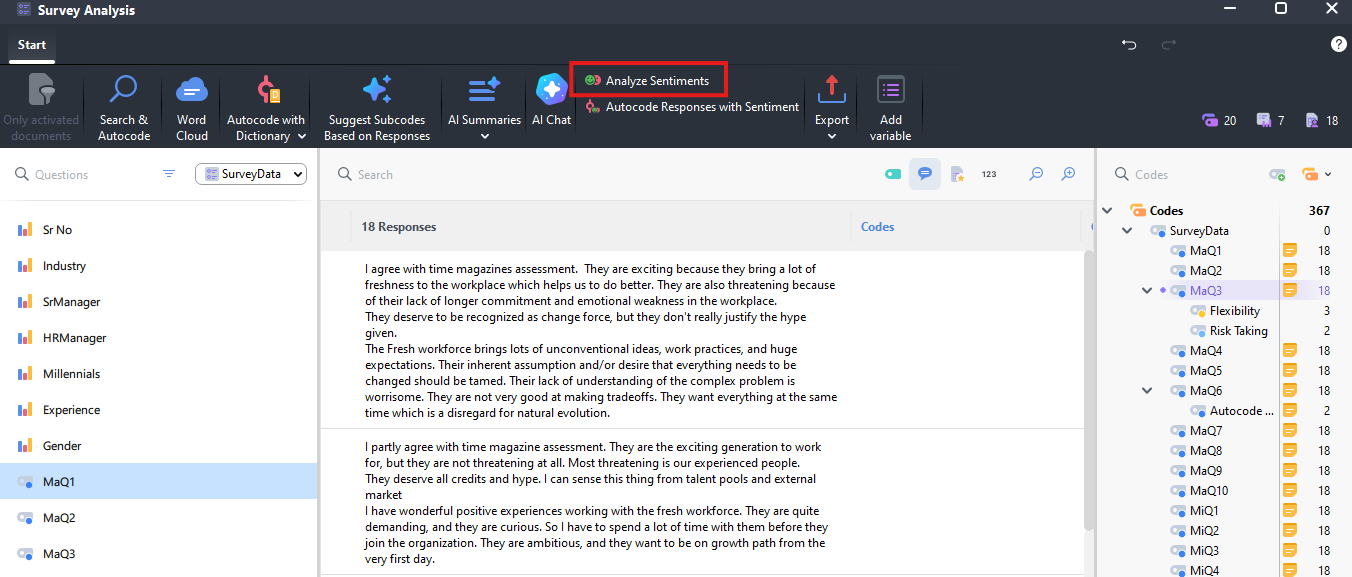
- Select Analyze Sentiments from the top ribbon menu. It will create additional columns next to the responses and assign a sentiment for each response looking for positive and negative words.
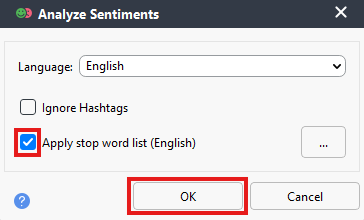
The Analyze Sentiments window will open. Select Apply stop word list (English) and then click OK.
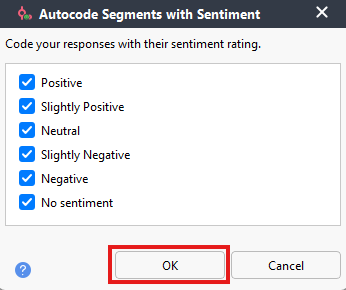
You should always read through the results to see if you agree with the sentiment assigned. If we’re happy with the sentiment, we can have it autocode the responses. Click on Autocode Response with Sentiment. Keep the defaults and click OK.
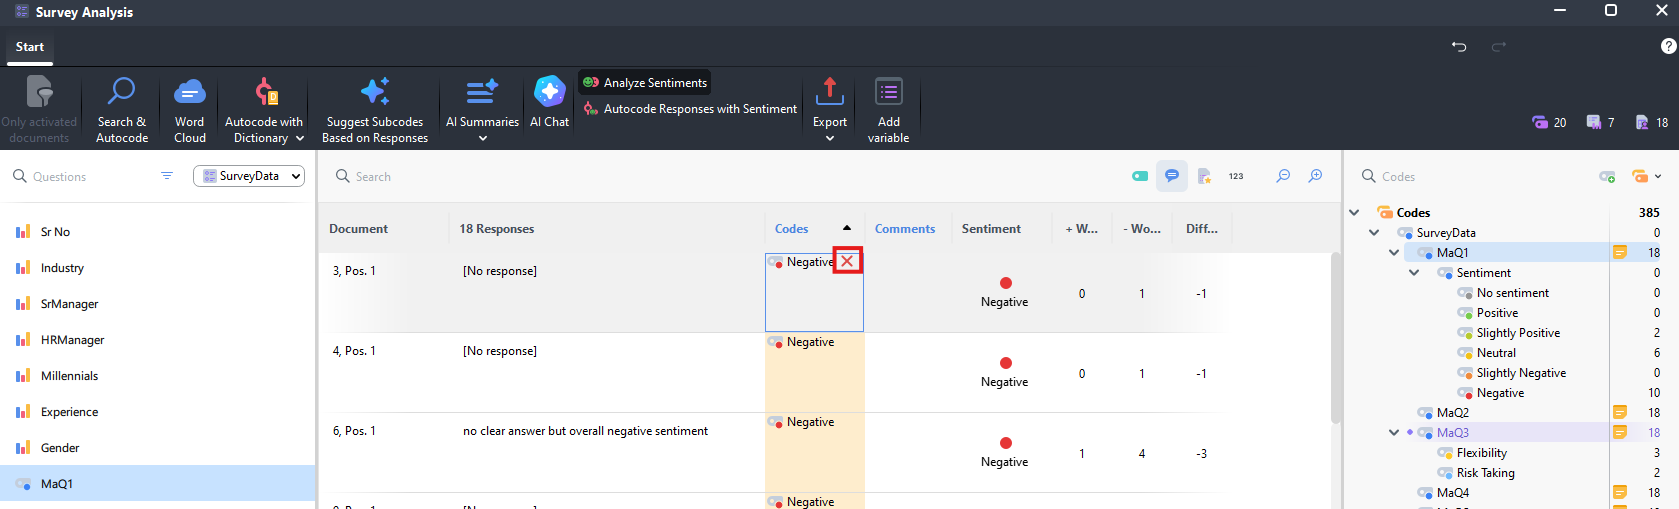
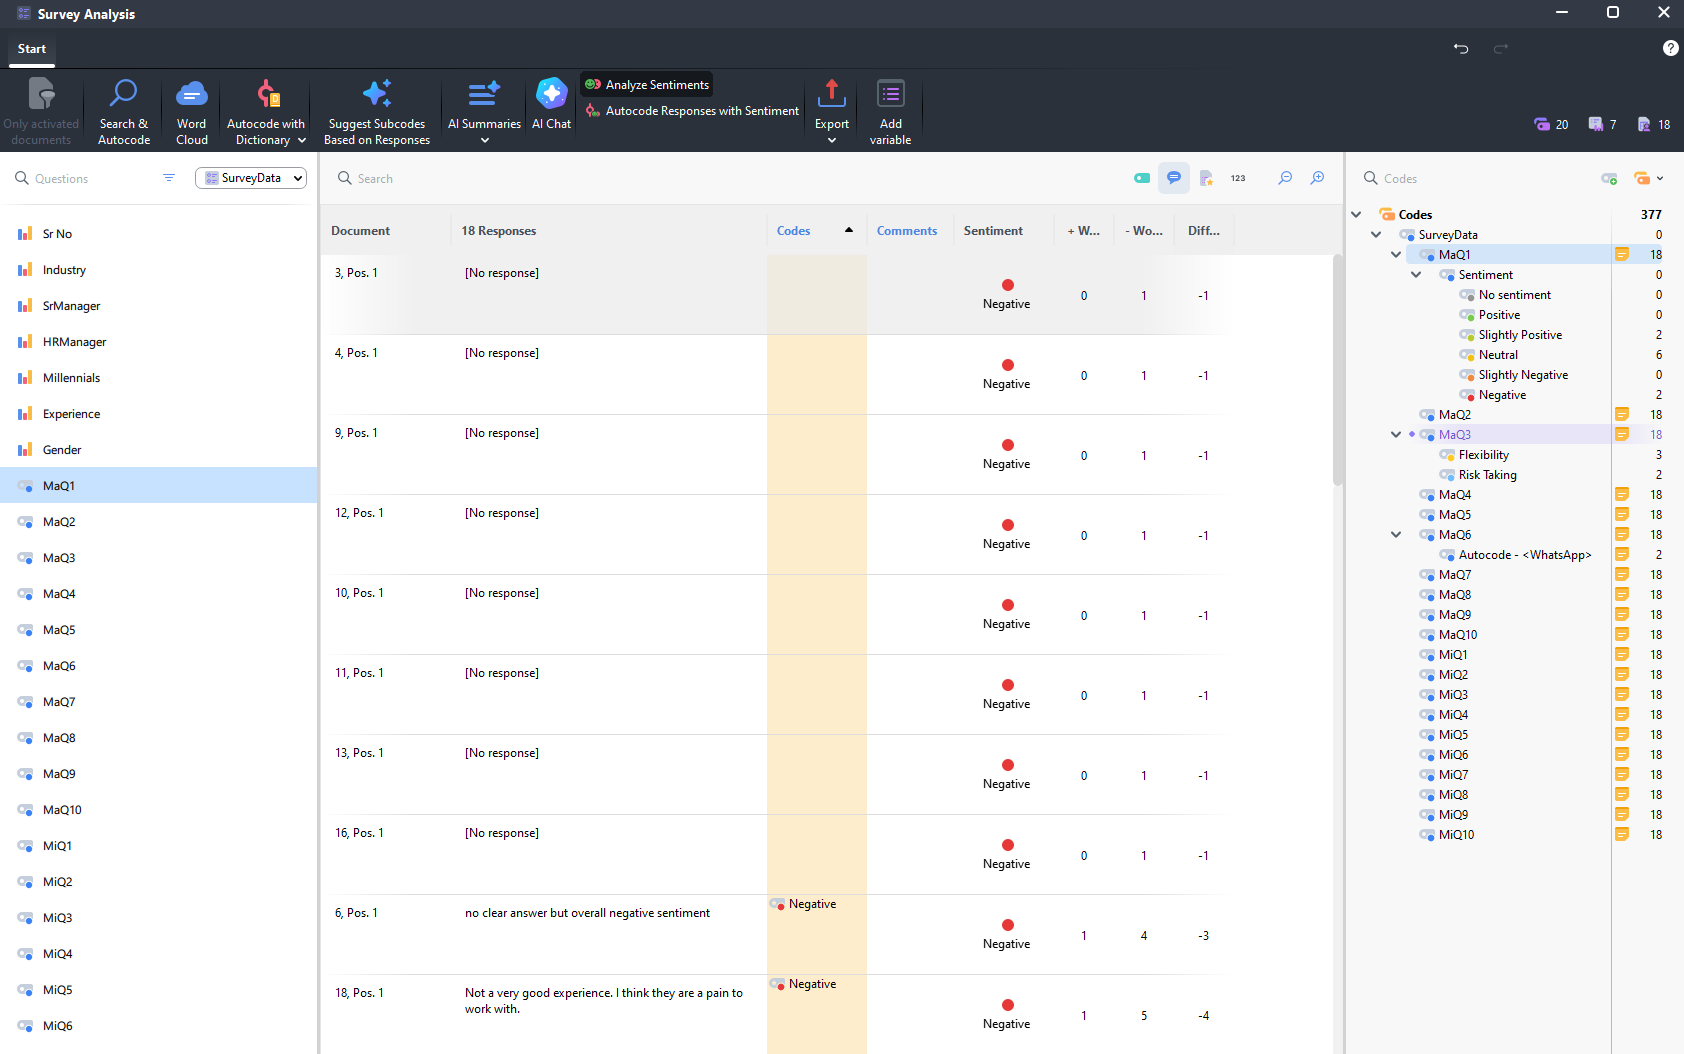
New codes have been added. If we click on the Codes column heading, we can sort the coding together. Take a look at the Negative codes. We see that [No response] has been grouped under there, when we might prefer to have it coded as No sentiment. Hover over the Negative code for each [No response] entry and click on the red X to remove the Negative coding for those entries.
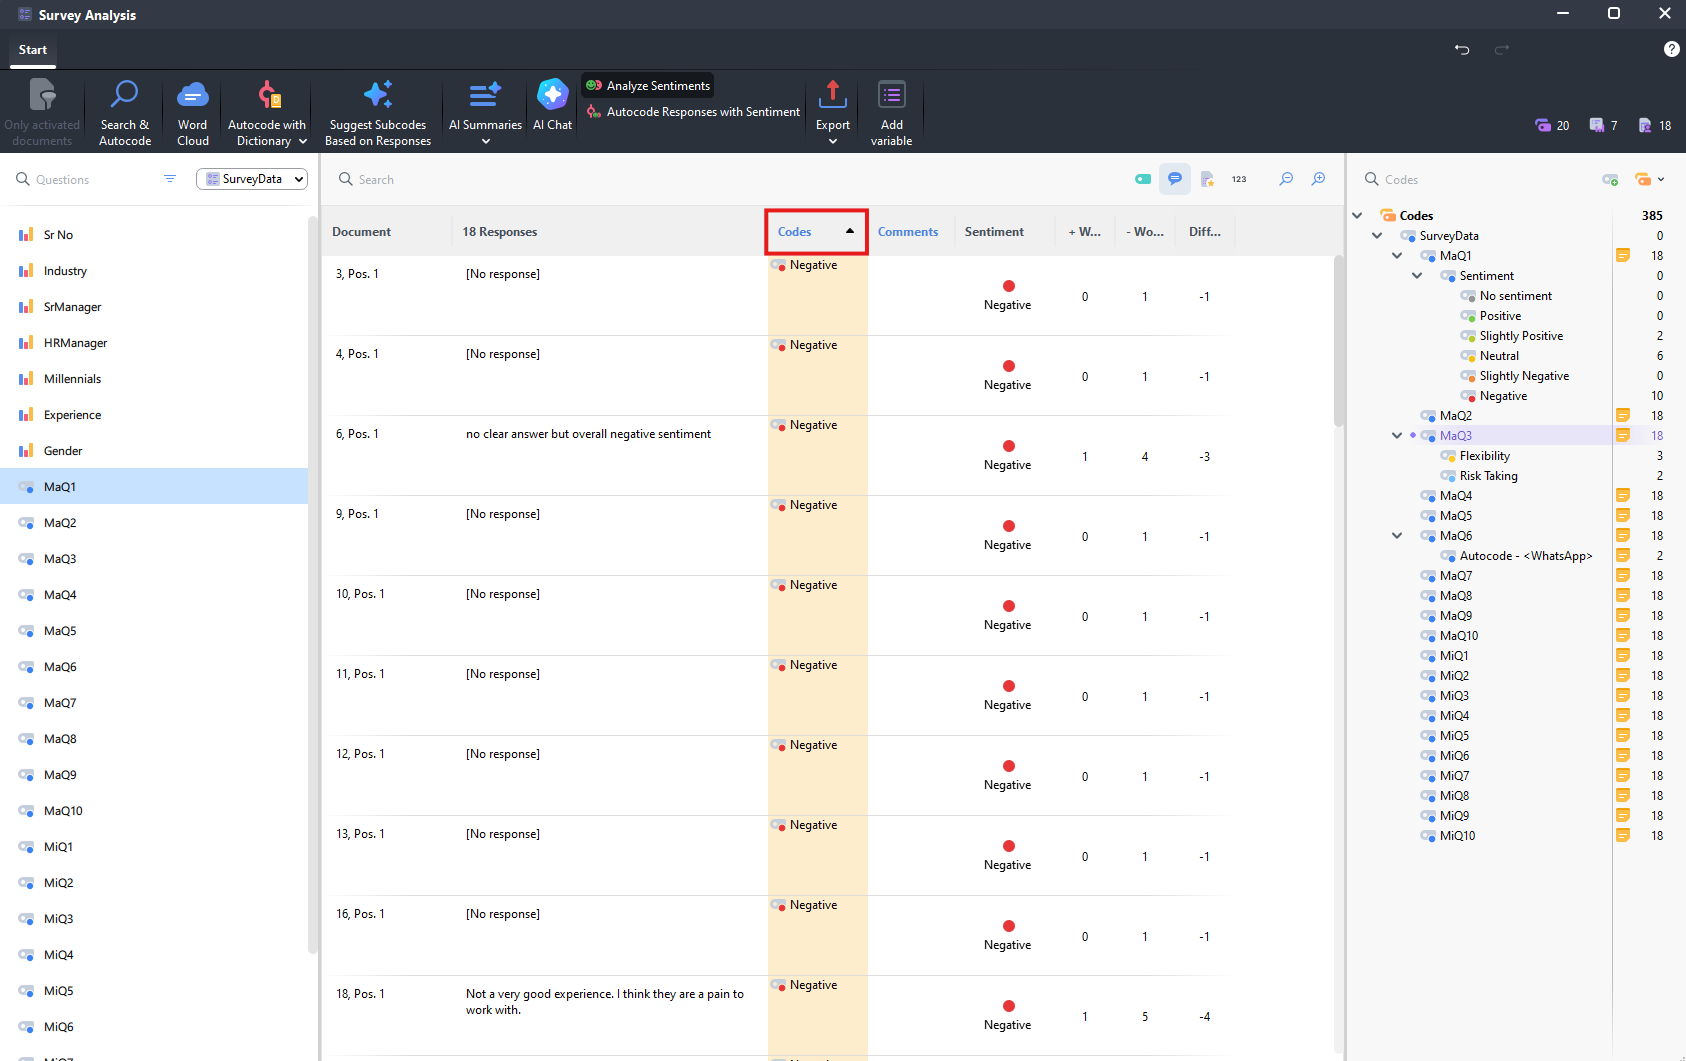
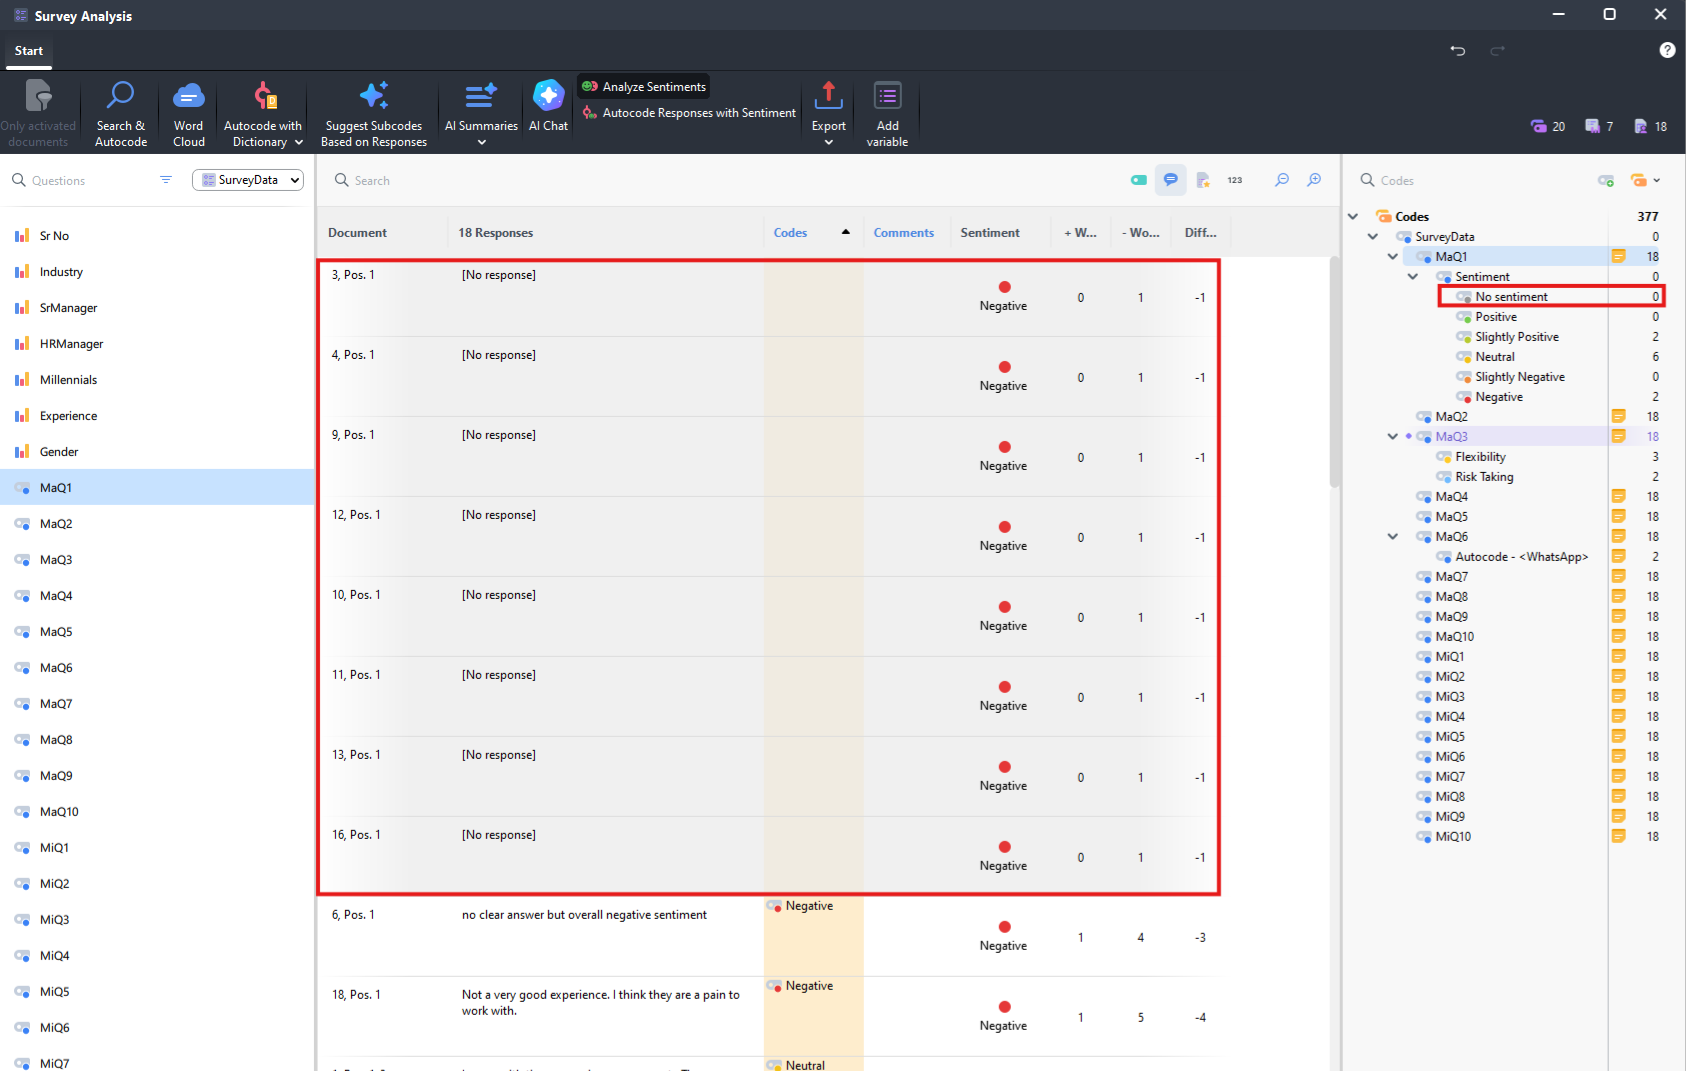
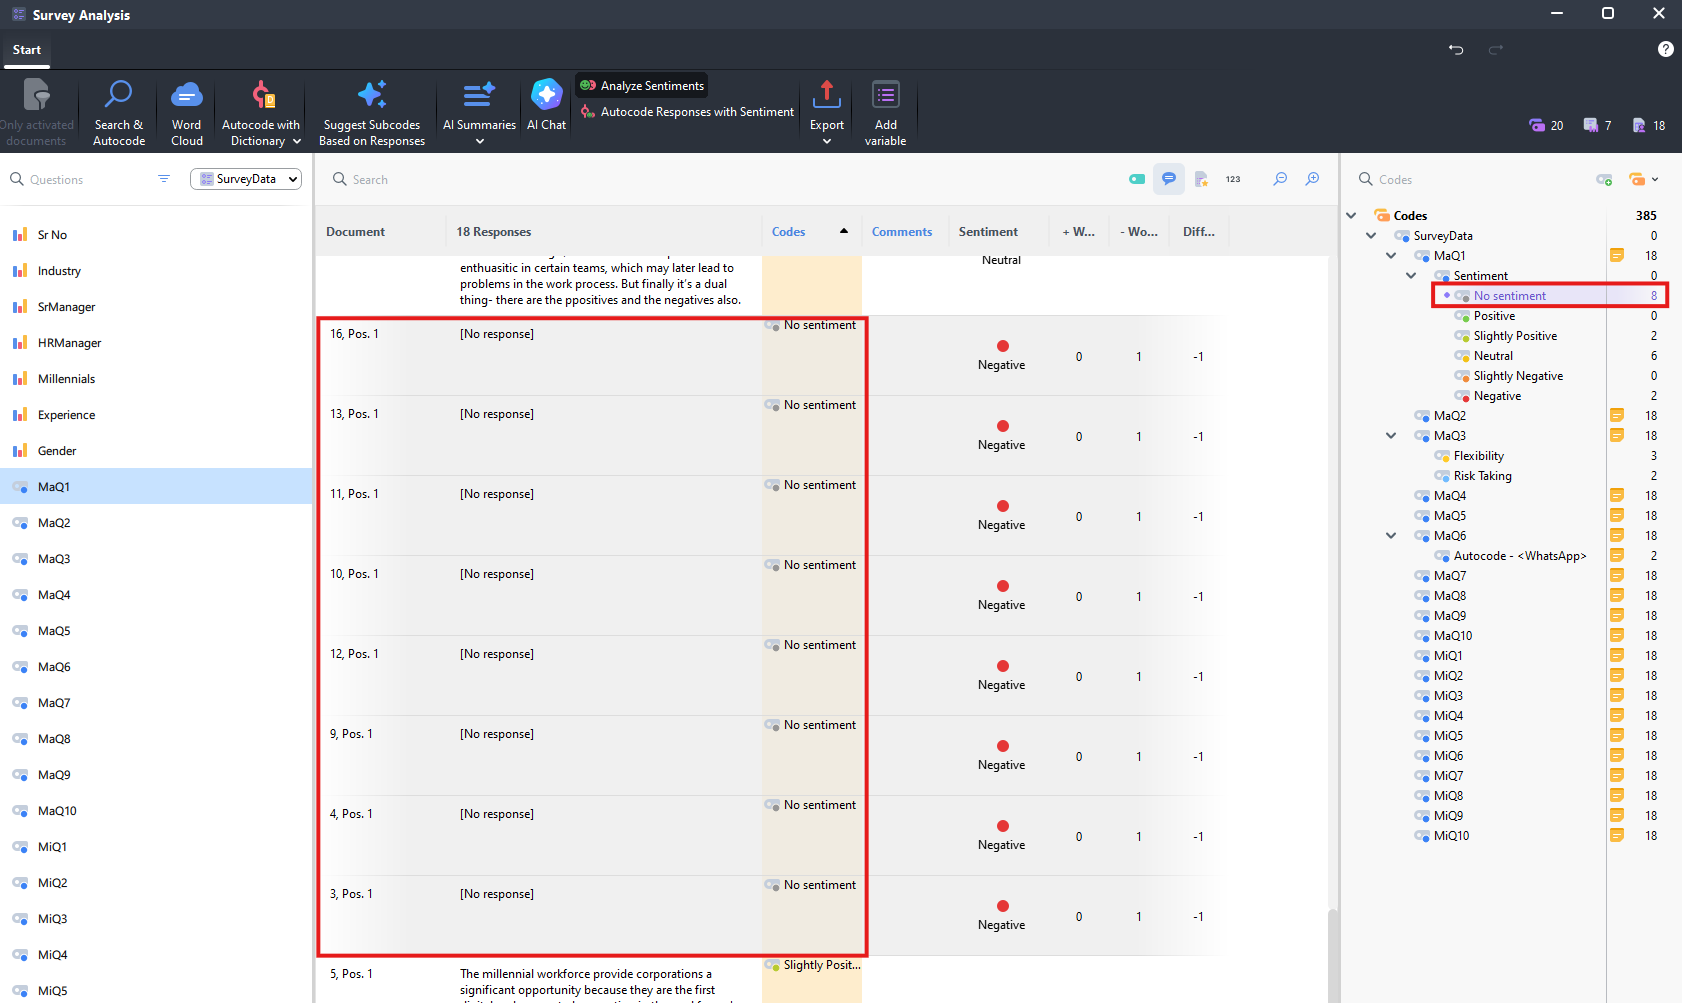
Then select all 8 [No response] entries and drag them over to the No sentiment code on the right. You can now see them all categorized as No sentiment if you scroll down. This kind of sentiment analysis can work really well on simple responses to a question that asks for an opinion. But it is always good to read through the results to see how accurate the coding has been.
- You can learn more in the MAXQDA manual, Analyzing Surveys section.
That’s it for today! For more information, see our MAXQDA Guide.
Technique: Qualitative Data Analysis | Tools: MAXQDA