Importing Alternative Sources in NVivo 12 for Windows
NVivo can handle many types of files, such as text, audio, videos, images, etc. You would import these from the Import Ribbon, by choosing the Files option. However, this tutorial will show you two common sources of data that you might want to code in NVivo that are a bit more complicated to import.
The first part is on NCapture, a tool that lets you easily capture webpages as PDFs.
The second part is on importing survey data into NVivo.
NCapture
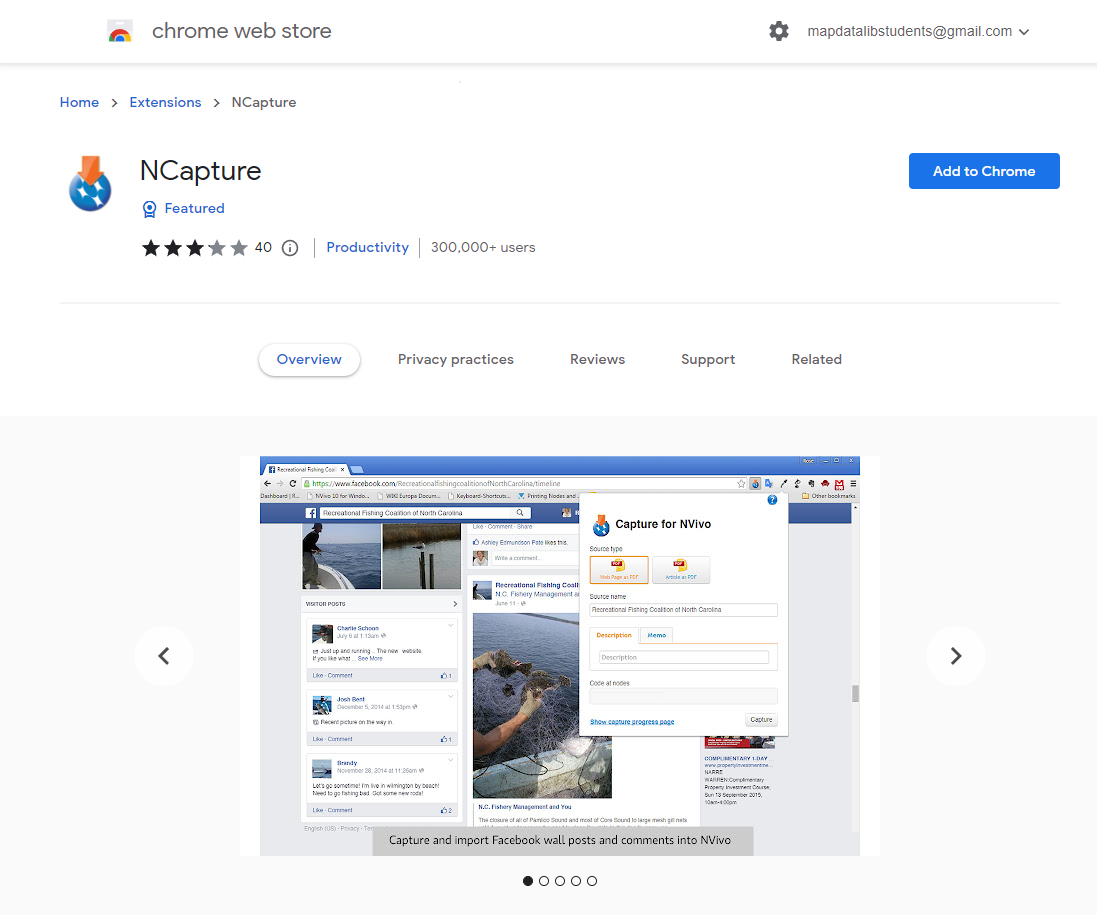
You may want to import in content from the web, and NVivo can help with this. To do so, you need to install a plugin for Google Chrome. Most web pages can be captured as PDFs. You can also capture some pages from Facebook, Twitter and YouTube as datasets, videos and pictures. NCapture files (.nvcx) contain your captured content as well as the URLs, capture times and any additional information such as a description, memo and coding that you specified at the time of capture. To use NCapture, you would use Chrome to go to the page you want to capture, and then click on the NCapture button to capture the content. These NCapture files can then be brought into NVivo to analyze. However, I will warn you that it is fairly limited in its use and the results can be unpredictable – it’s really best for capturing web pages. For extensive social media data gathering, other tools are better suited than NVivo to capture them.
For this tutorial, let’s capture an article for analysis in NVivo.
1. First we need to install NCapture in Chrome. Go to NCapture for Chrome in the Chrome Web Store.
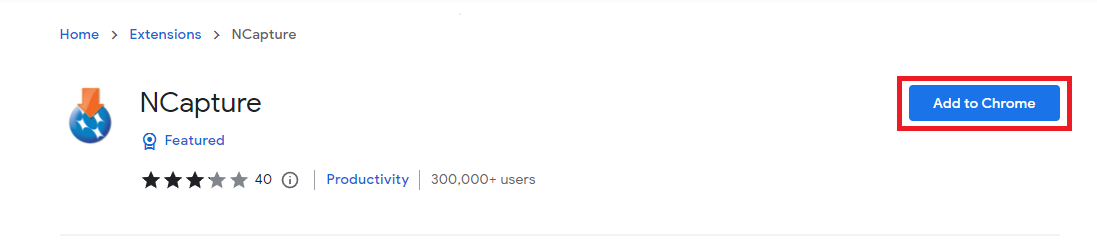
2. Click the Add to Chrome button.
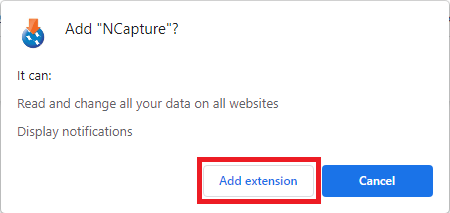
Then click on Add extension to confirm.
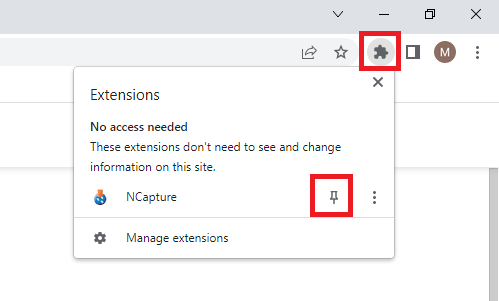
NCapture for Chrome is added to Chrome, with an icon in the toolbar. If you don’t see it, click on the puzzle piece to display all your extensions, and then click on the pin icon to pin NCapture to your extensions bar.
3. Next, let’s try a really simple example of capturing a webpage as a PDF file. Use Chrome and go to this URL: https://www.theglobeandmail.com/business/industry-news/property-report/article-demand-for-storage-space-in-the-cloud-creates-a-land-rush/
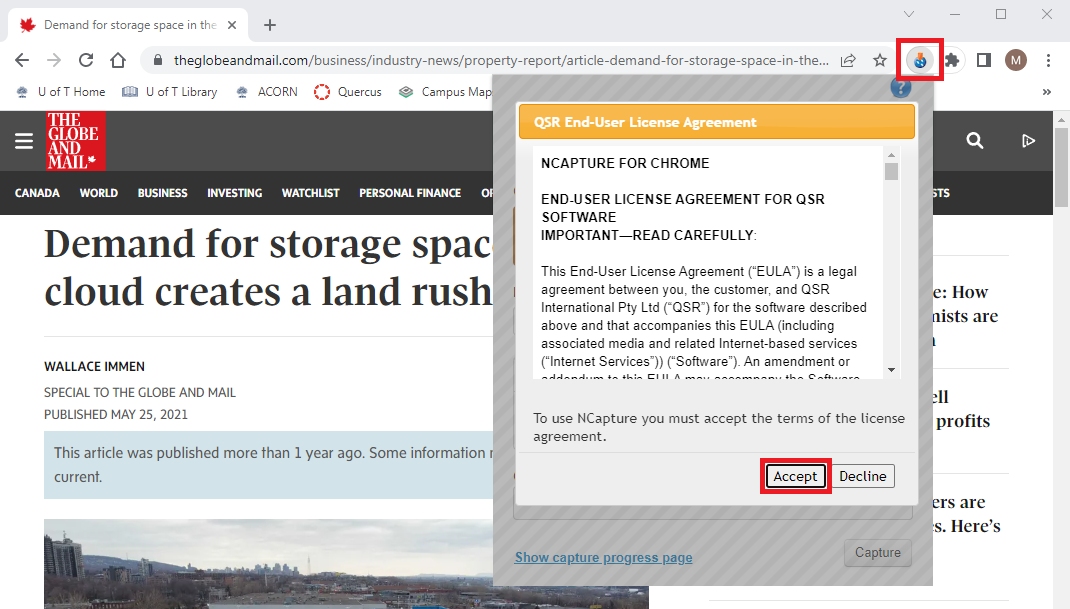
4. Click on the NCapture icon on the top right of Chrome (you will need to accept an end-user license agreement the first time you use it).
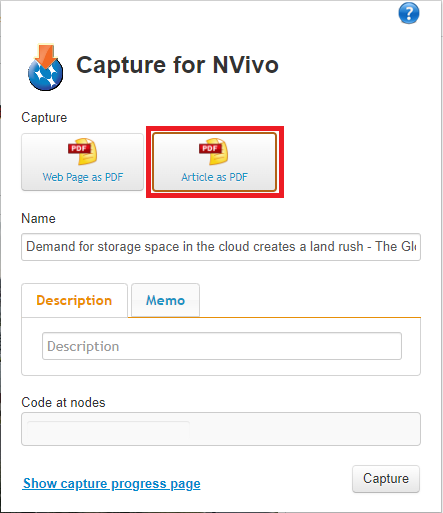
5. When you click on the NCapture icon, you are presented with the choice of capturing the entire page, including headers, ads, etc. or just the main article itself as a PDF. Let’s choose the article – so select Article as PDF.
6. You will see it shows you a simplified version of the page and what it will capture.
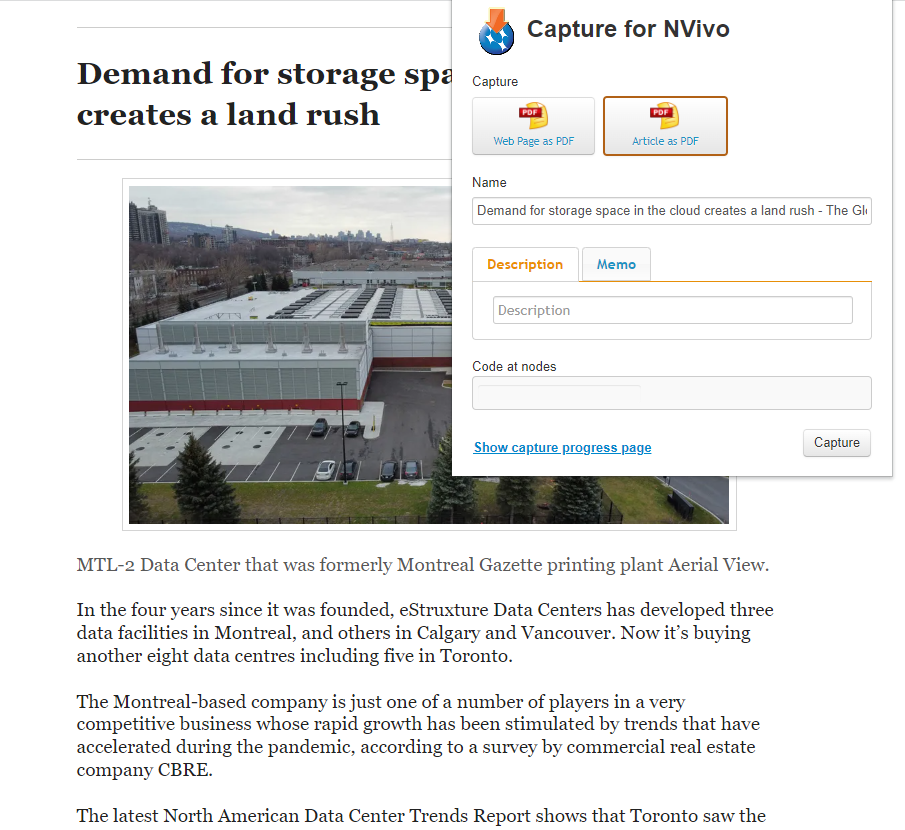
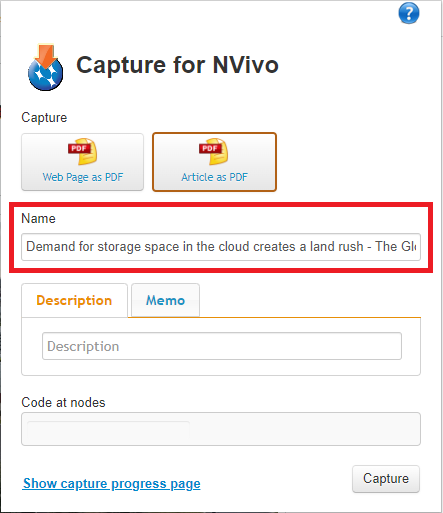
7. You can give it a name if you like, but let’s keep the default name in this case.
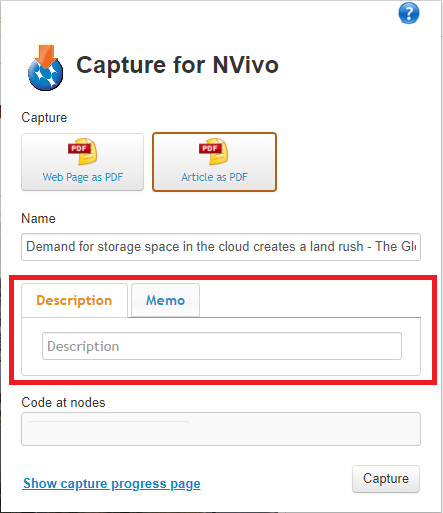
8. We could provide a description and/or attach a memo if you like. We can skip that for now.
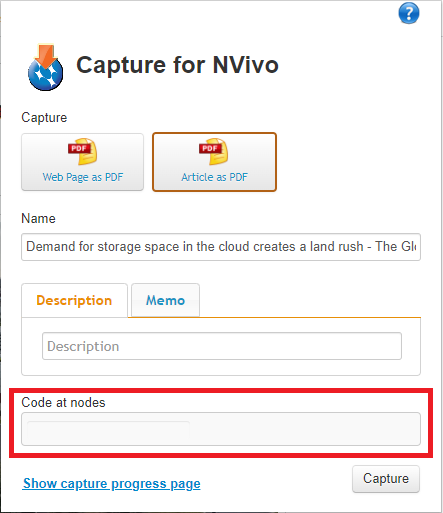
9. You can also code the entire thing with a node, if appropriate. Let’s leave it blank.
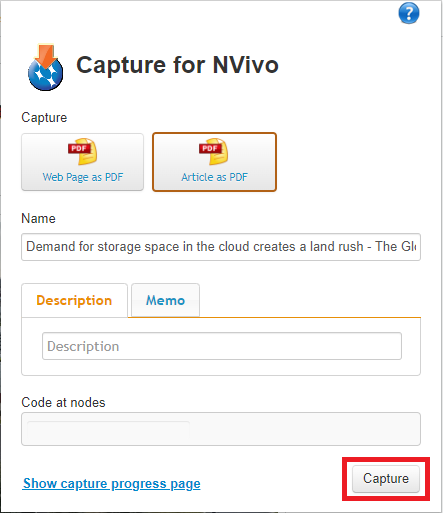
10. Finally click on the Capture button.
You will see a small window pops up on the bottom right corner. Click on the link to see a full progress page in Chrome, because the pop-up window will disappear after a short while, even if the capture has not finished (if you don’t see a pop-up, you can click on the NCapture icon again to find a link to the progress page).
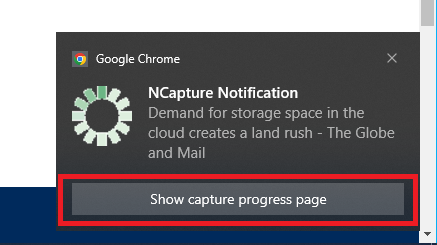
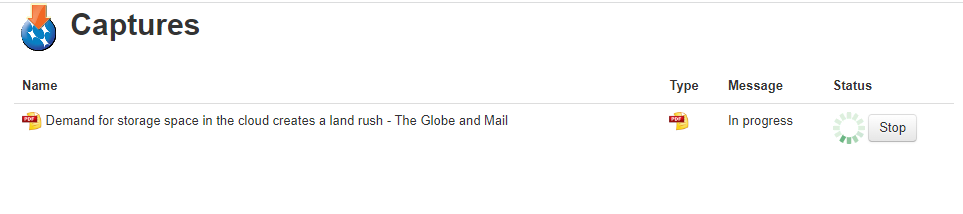
The progress page will allow you to stop the capture, if you made a mistake or it is taking too long.
11. It should capture the page fairly quickly and another small window pops up on the bottom right corner that will notify you when the capture is complete. A pop-up window may ask you where to save the file. Save it somewhere you can find it, such as your Desktop. If you are not prompted about where to save the file, check your Downloads directory, as that is often the default location where items will be saved.
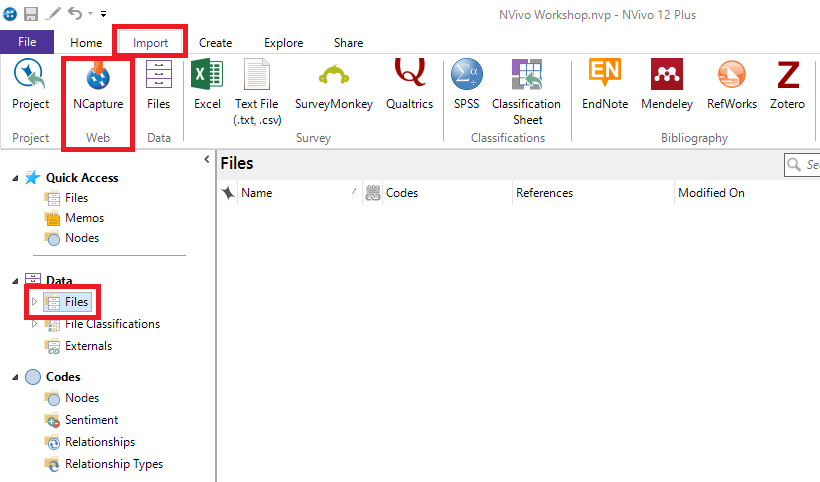
12. Then go back to NVivo. From the left menu, under Data, click on the Files folder, and then go to the Import Ribbon. Select NCapture.
13. Browse to the folder where the capture was saved.
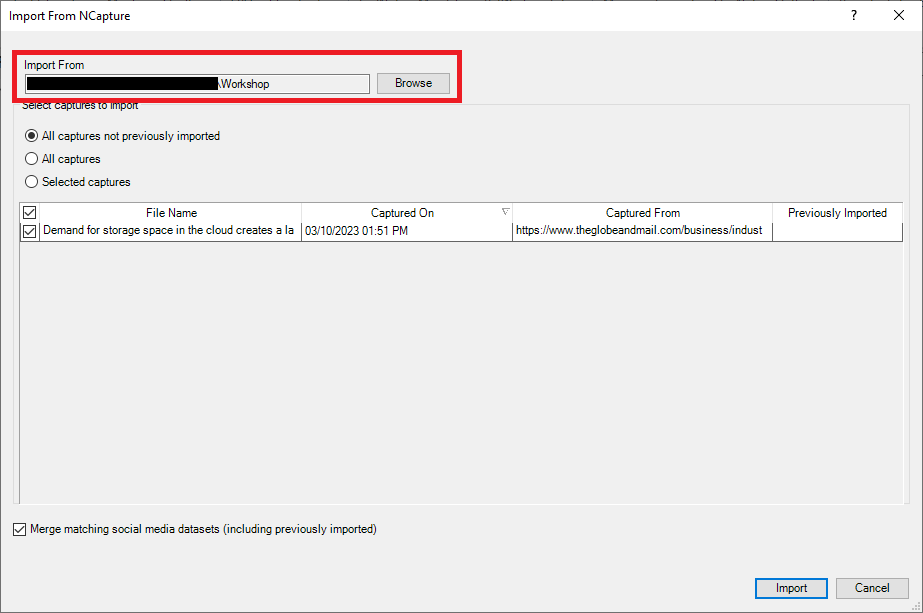
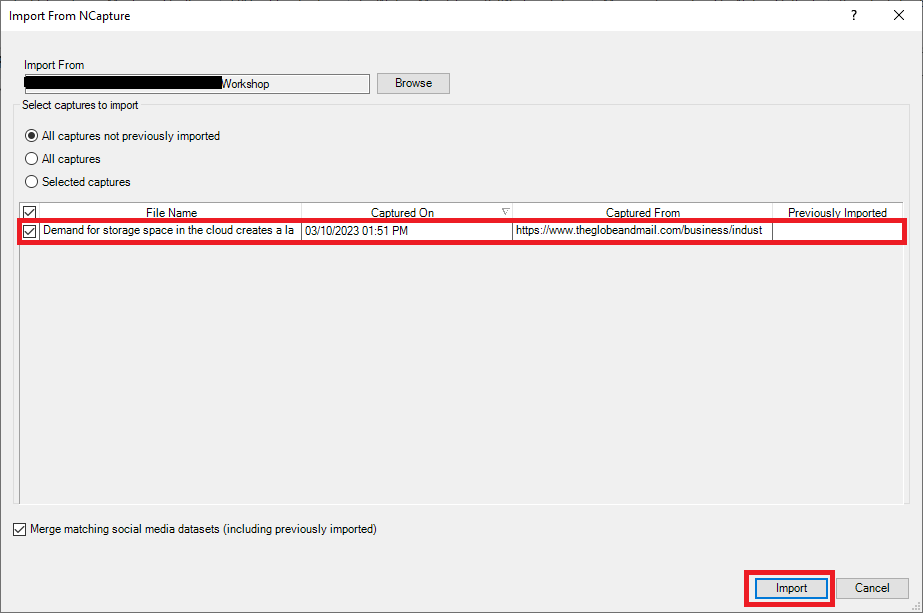
14. You should now see the file in the list. Finally, click on Import.
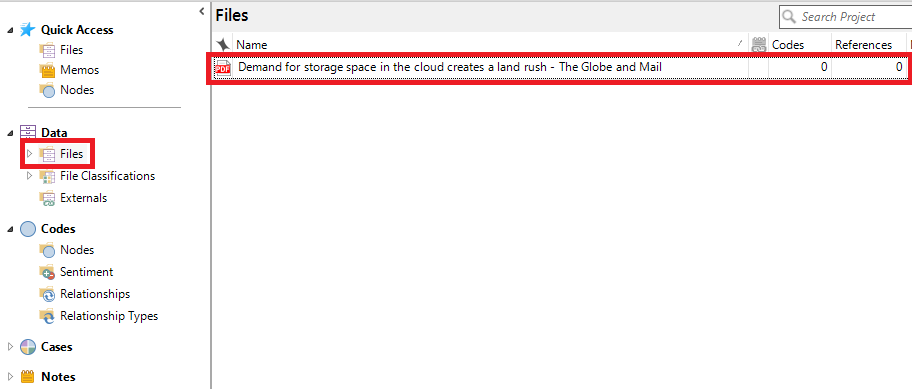
15. NVivo will import the PDF file into your Files folder, but you can then move it to reorganize your files, if you wish.
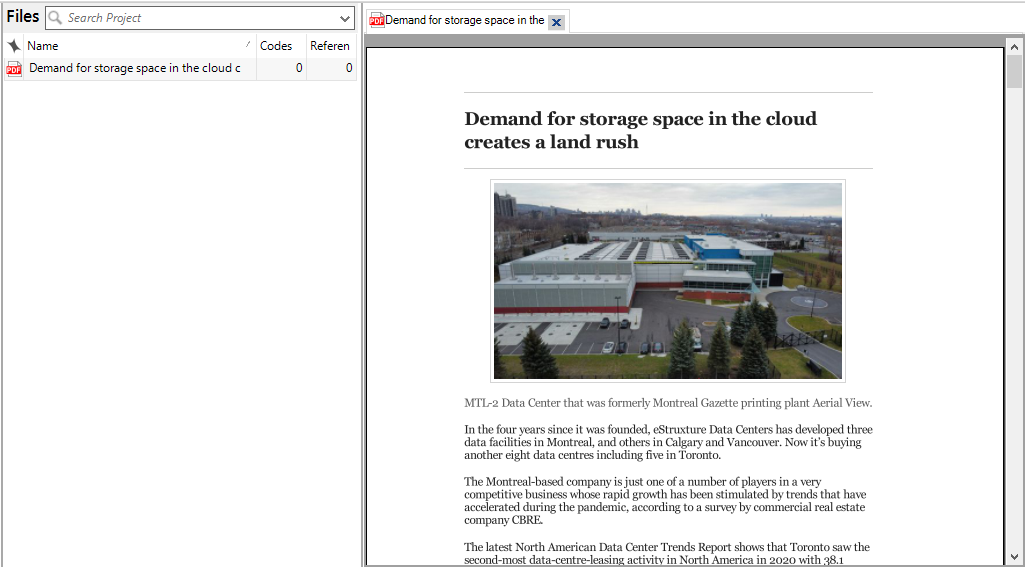
16. If you double click on it, it will open up the PDF, and you will be able to read it and code the text.
Survey Data
Another common data type that you might want to use NVivo to analyze is survey data. NVivo can import survey data in directly from SurveyMonkey and Qualtrics, so if you use those tools, just select those options from the Import Ribbon. However, you may have your survey data just stored in a spreadsheet, where each row is a survey respondent’s answers and each column is a question. We can also import this type of data into NVivo.
Note: This activity assumes you are familiar with case classifications and cases in NVivo. If case classifications and cases in NVivo is new to you, you can learn more in our Introduction to NVivo 12 tutorial!
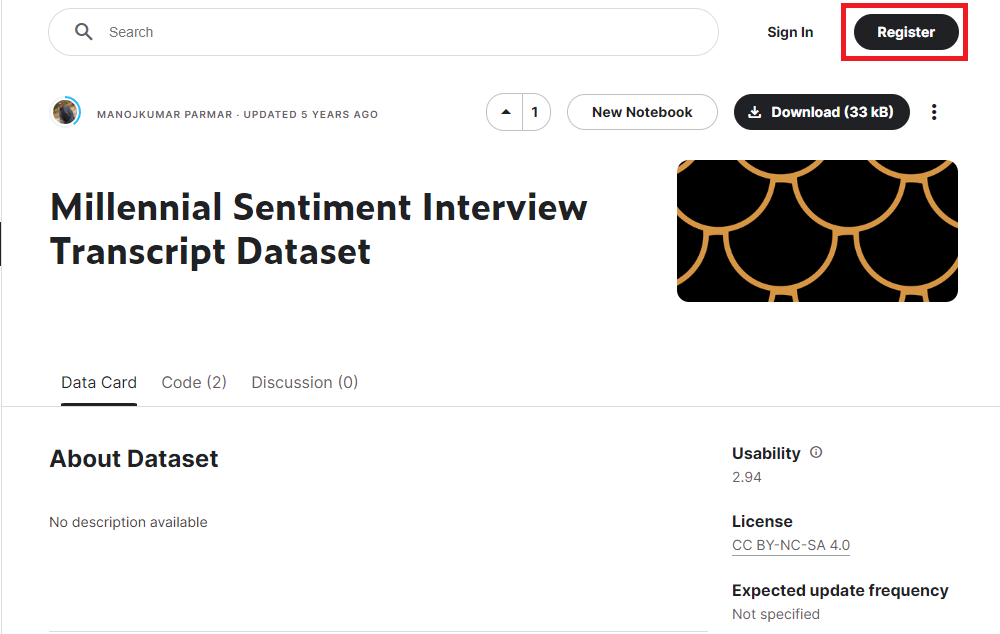
1. To start, let’s download a small sample of survey data called theMillennial Sentiment Interview Transcript Dataset. This data set is hosted on Kaggle, which is an public data platform. To download this data you’ll first have to register for a free account (or sign in if you already have one). Click Register at the top right of the website.
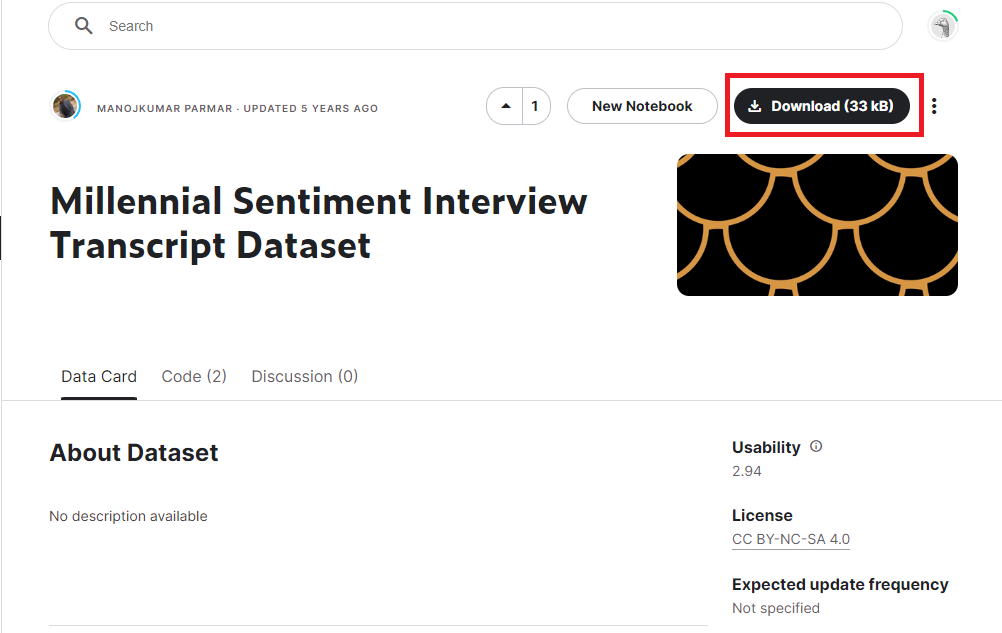
After you’ve signed in, click Download and save it somewhere you can find it, such as the Desktop.
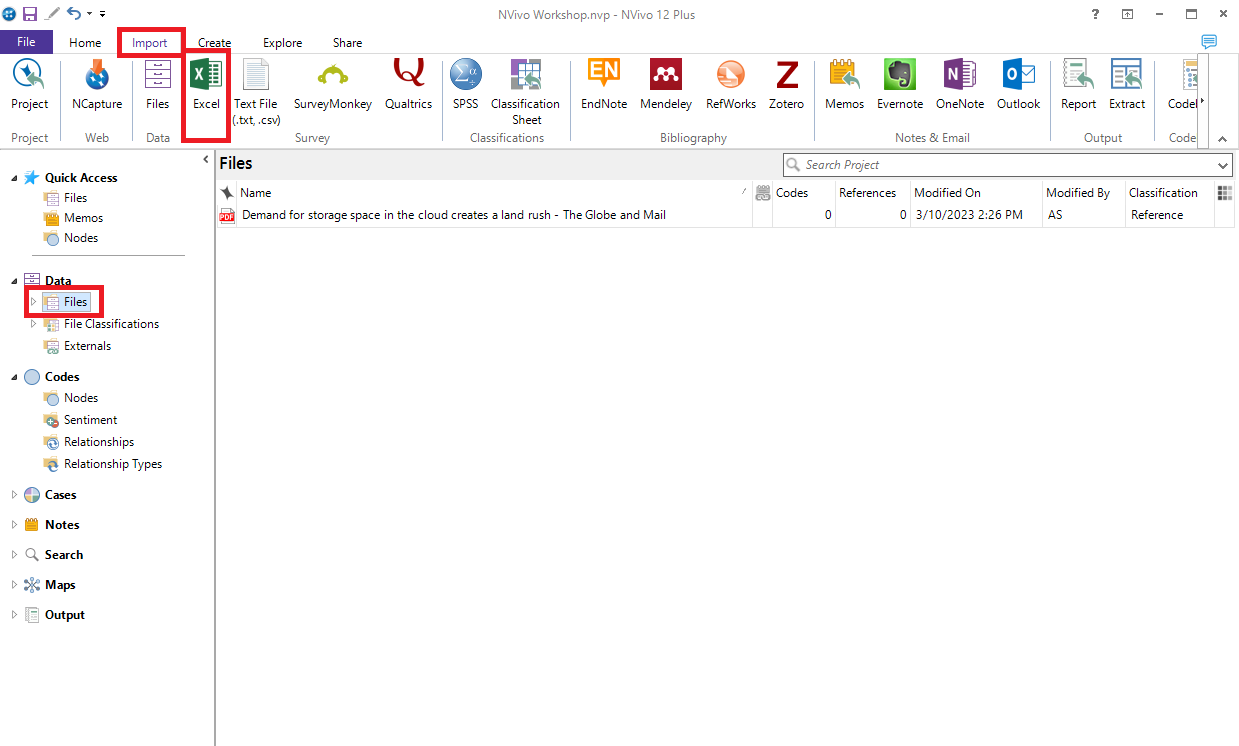
2. Go to NVivo. From the left menu, under Data, click on the Files folder, and then go to the Import Ribbon. Select Excel.
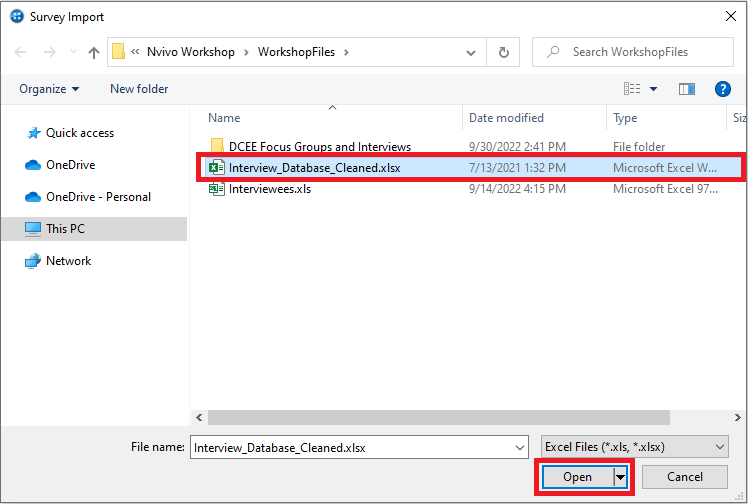
3. Browse to the folder where the Millennial Sentiment Interview Transcript Dataset (file Interview_Database_Cleaned.xlsx) was saved. Select the file, and then click on Open.
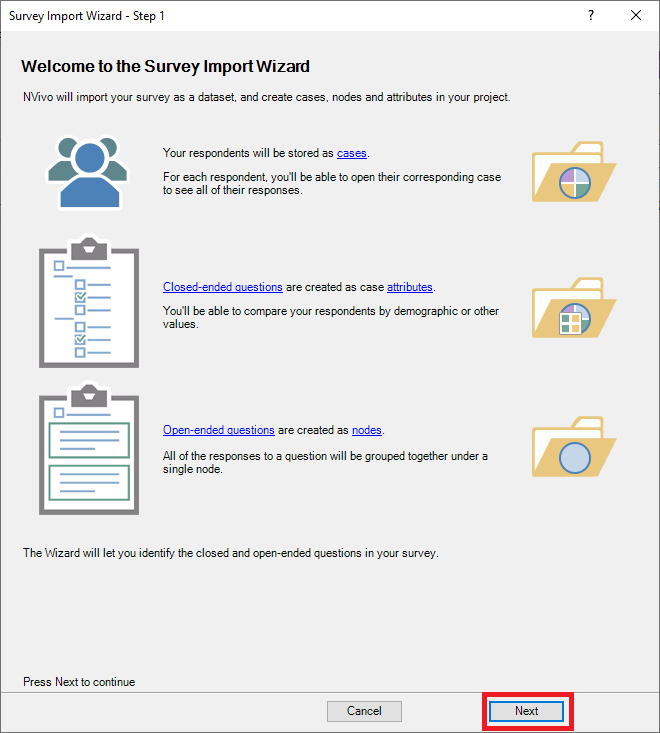
4. NVivo’s Survey Import Wizard will open up to help you import your data. For each row, it will create a case for the survey respondent. For each closed-ended question that it detects, it will capture that information about the survey respondent as case attributes. Then it will import each open-ended question as spreadsheet content that can be coded, and automatically code each question’s response with a new code for that question. Let’s go through the wizard together to see this in action. Click on Next.
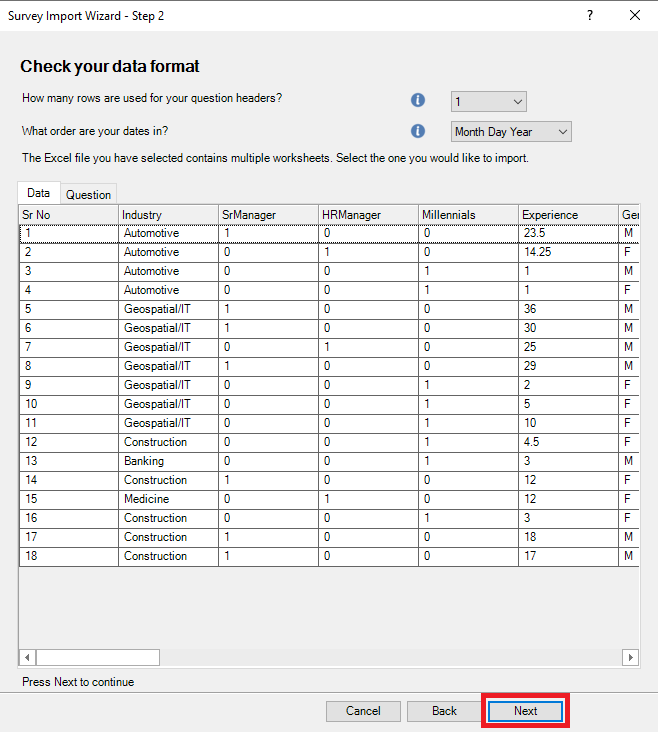
5. First it checks the data format. Our first row is our column headers, so we can keep the default. We don’t have any dates in our survey, so again we can keep the default, but if you are working with dates, then take a look at this option. It will also present you with a preview of the data. Click on Next.
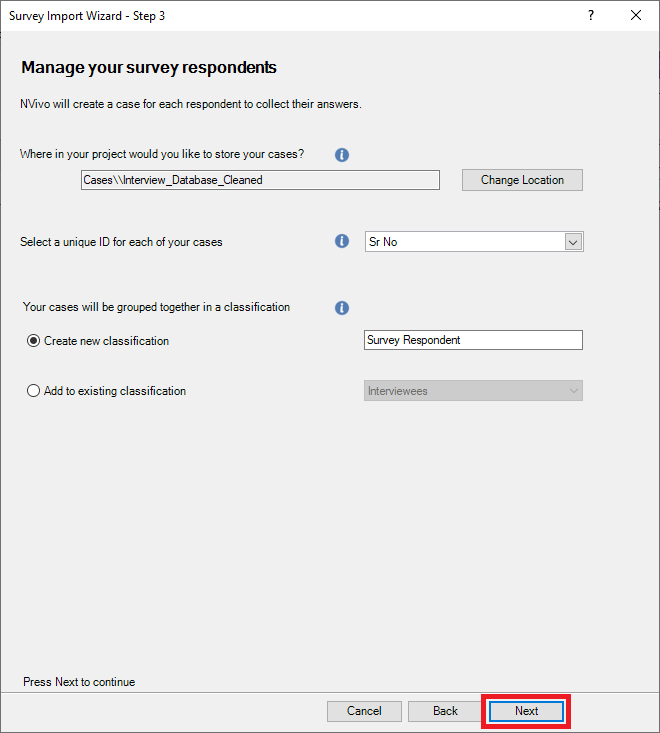
6. The next screen asks for information about creating cases and case classifications for our survey respondents (i.e., rows) in our dataset. In this case, we can keep all the defaults, as it will create a new case classification called Survey Respondent, and it will use the column Sr No as the unique ID for each case, which makes sense. Click on Next.
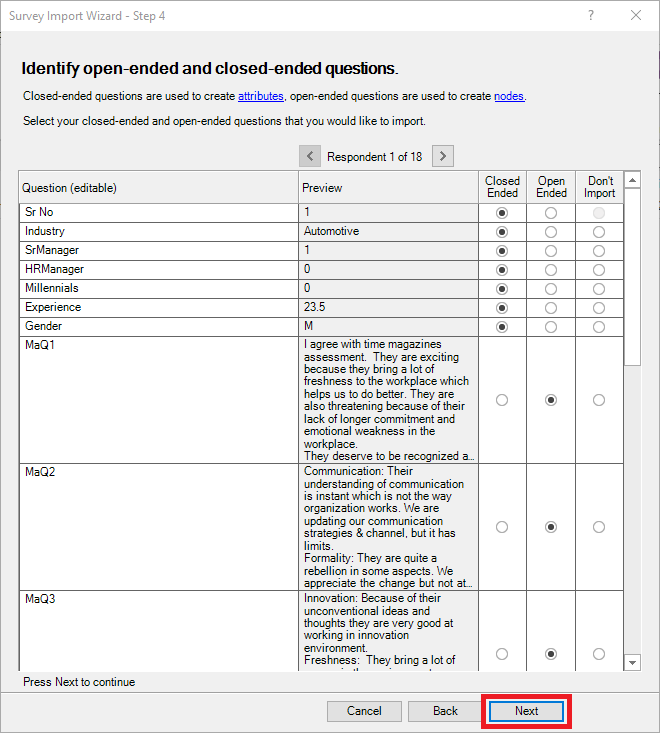
7. The next screen automatically detects which questions are closed-ended and will be used for attributes in this case classification. You can correct NVivo if there are any mistakes. You can also choose any columns that you don’t want to import. In our case, it looks good, so click on Next.
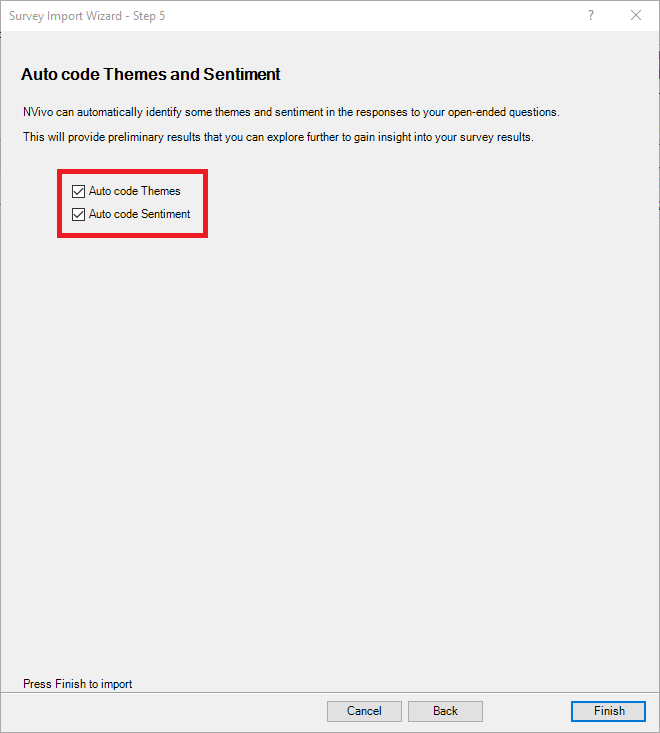
8. The next screen provides you an option to autocode responses by sentiment (i.e., positive or negative), and by themes, meaning NVivo tries to come up with themes based on the content of the text. Sentiment can be useful, especially if you have a huge amount of survey responses and won’t be manually coding all the answers, but want to get a sense of the content. For example, a survey question might be – did you like a particular product, and then NVivo can code for sentiment to see if generally people liked it or didn’t like it. Thematic coding is trickier and may not result in a lot of useful information. You can always give it a try if you like and then not use those codes if they don’t make sense. In our case, let’s keep both checked to see the results.
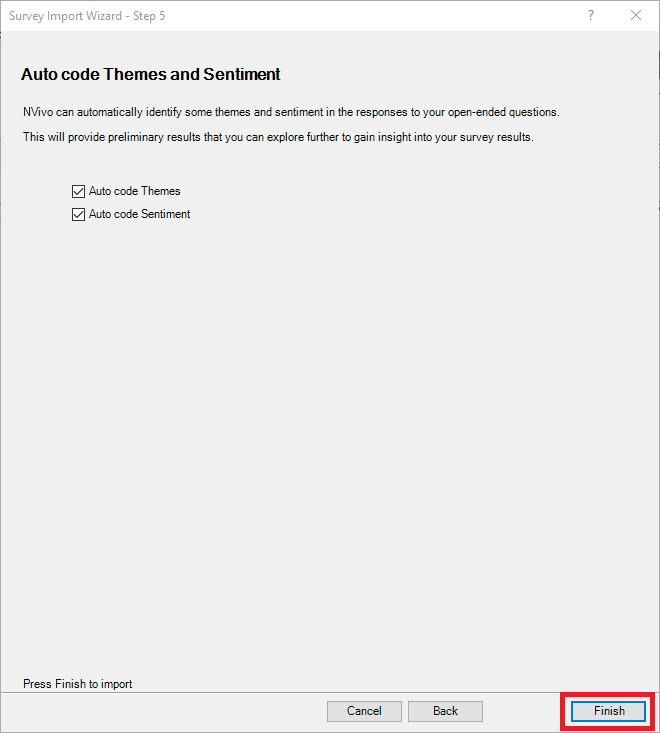
9. Then click finish to complete importing in our data.
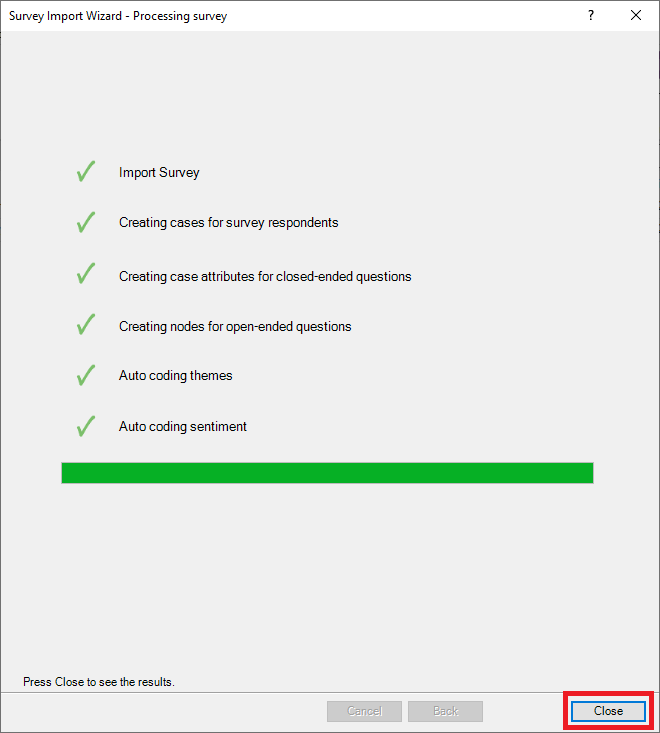
You will see a progress screen. Auto coding will take a bit of time to complete depending on the size of your survey. When it is finished, click on Close.
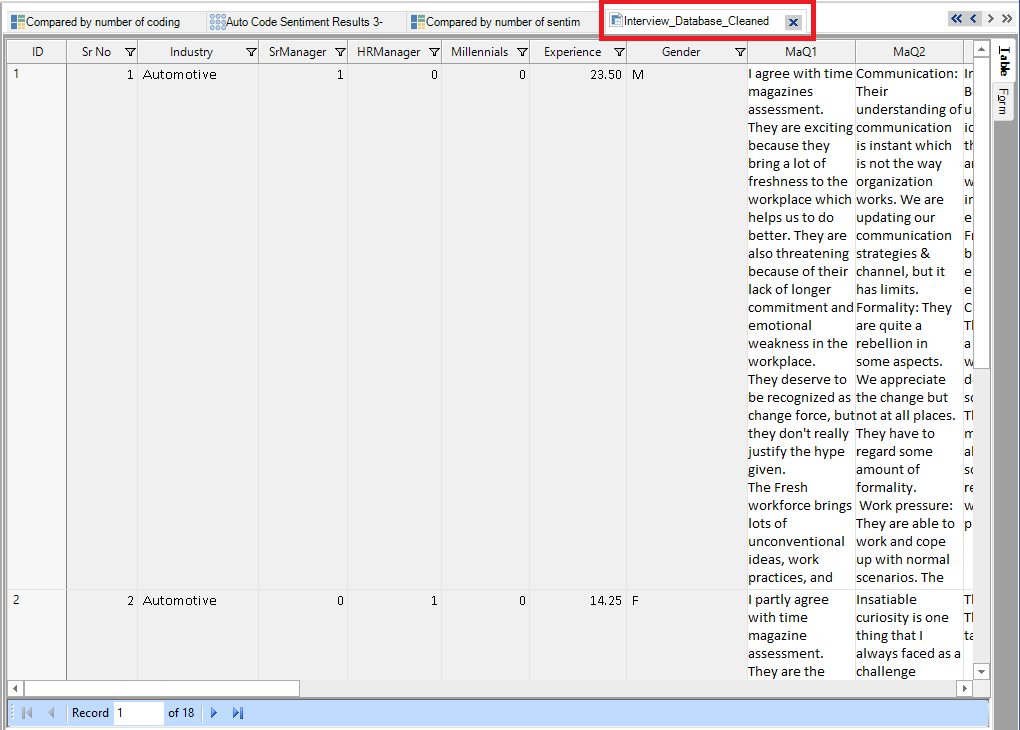
10. NVivo will open up a number of tabs with different views of the data. The first tab (on the far right) you will see is your survey data in spreadsheet format. This is where you can read through the responses and code the data.
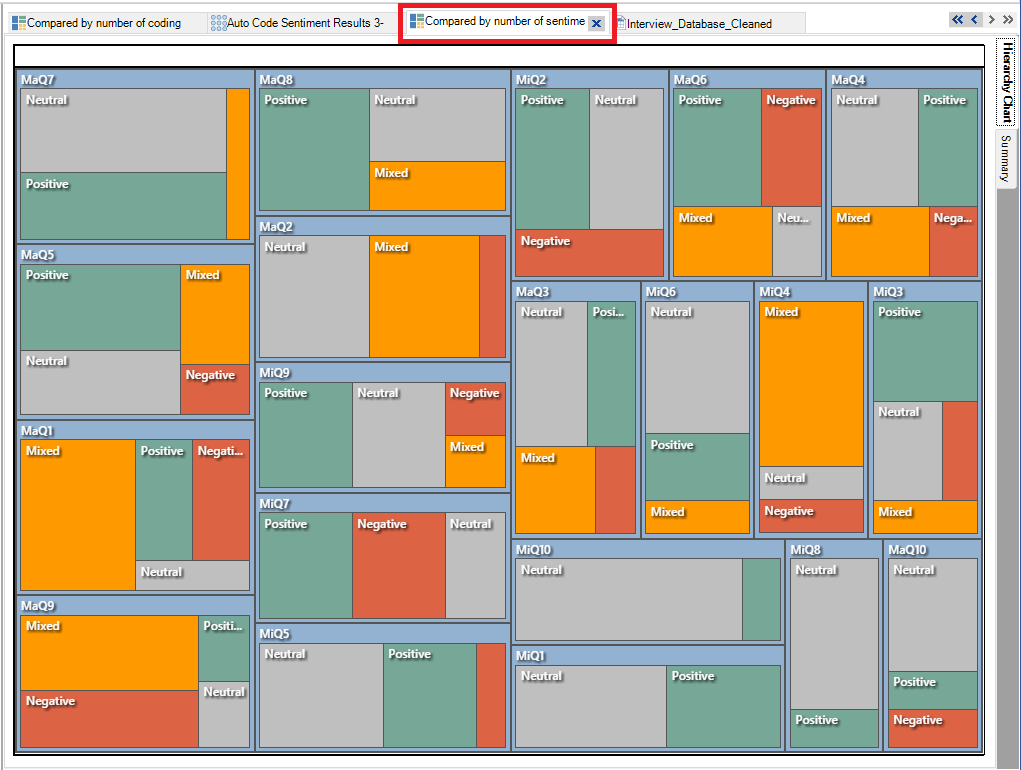
11. Moving from right to left, the next tab shows you a visualization of sentiment, but I don’t find it very useful, so I would close this tab.
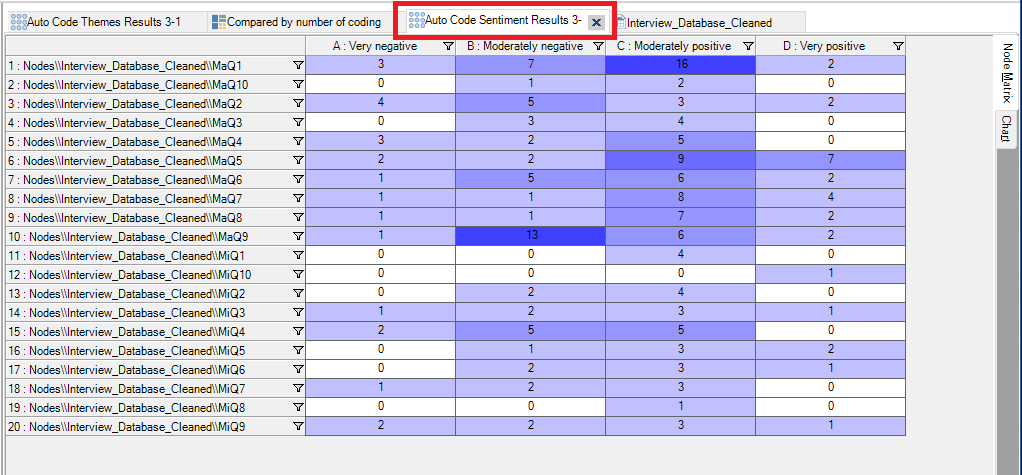
12. The next tab shows a matrix of sentiment by each survey respondent case. Here you can see generally if the survey respondent’s answers were fairly positive or negative, and spot some outliers.
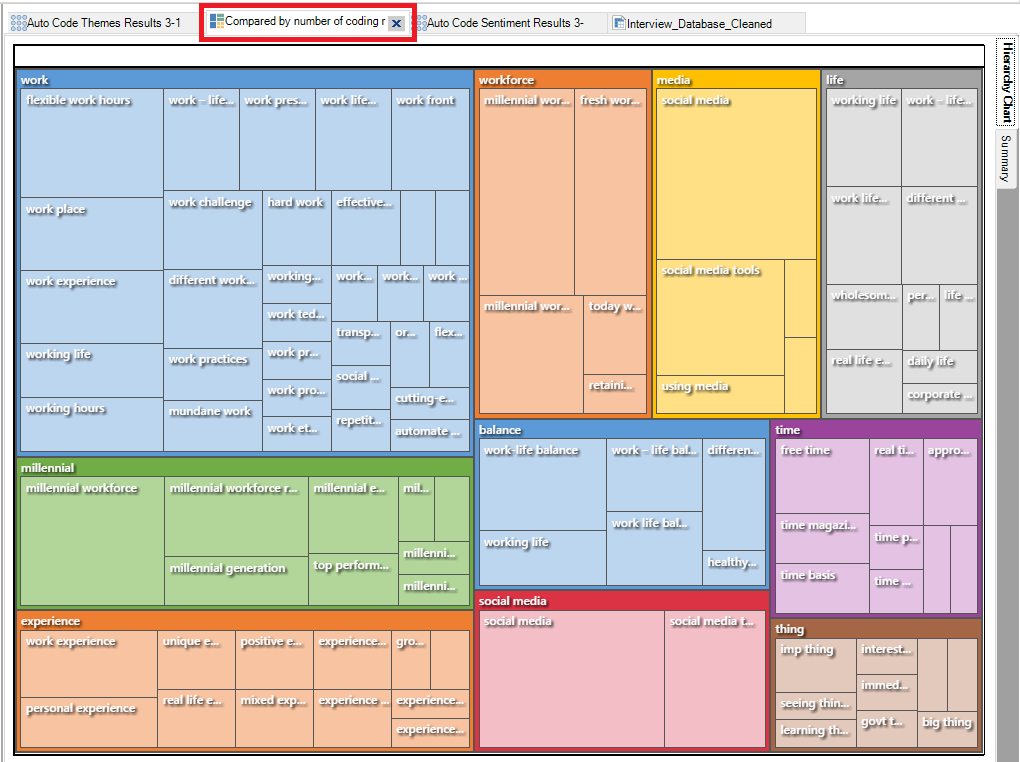
13. The next tabs shows a visualization of themes found in the survey data responses, where the boxes and sub-boxes are autogenerated nodes, and the size of the box is how frequent that node occurred.
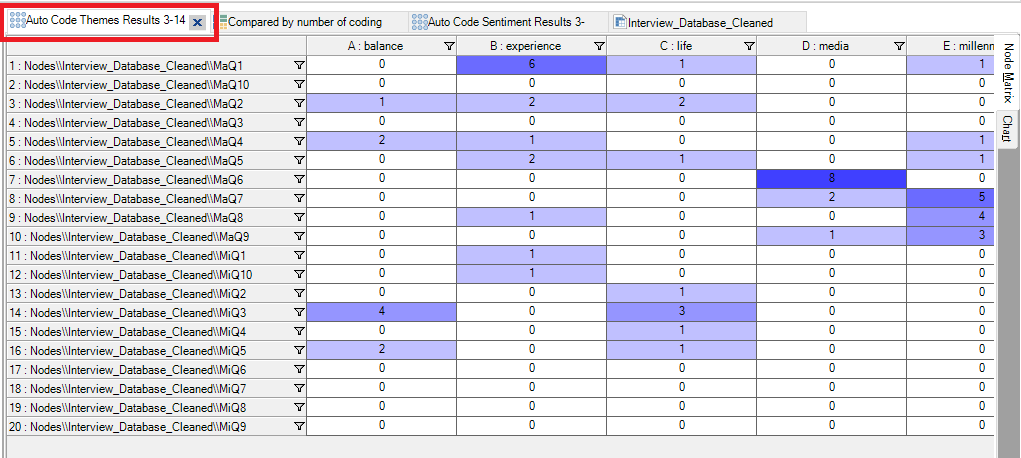
14. The final tab shows a matrix of the themes by survey respondent.
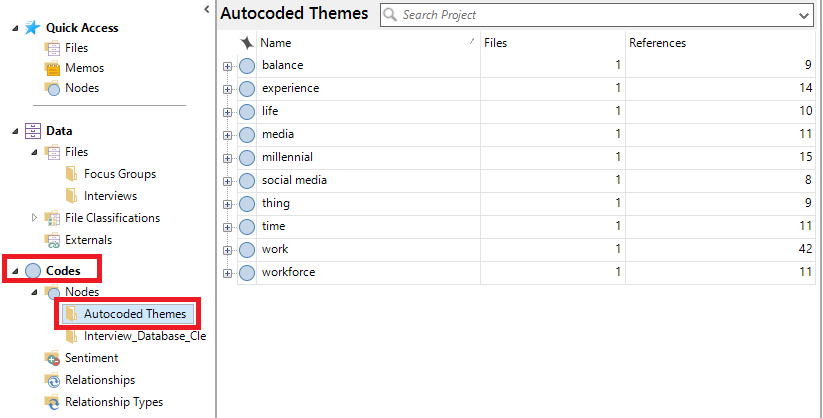
15. Using the left menu, under Codes, expand Nodes, to explore the autogenerated nodes. First click on the Autocoded Themes folder to explore the autogenerated nodes identified by NVivo in your content and their references.
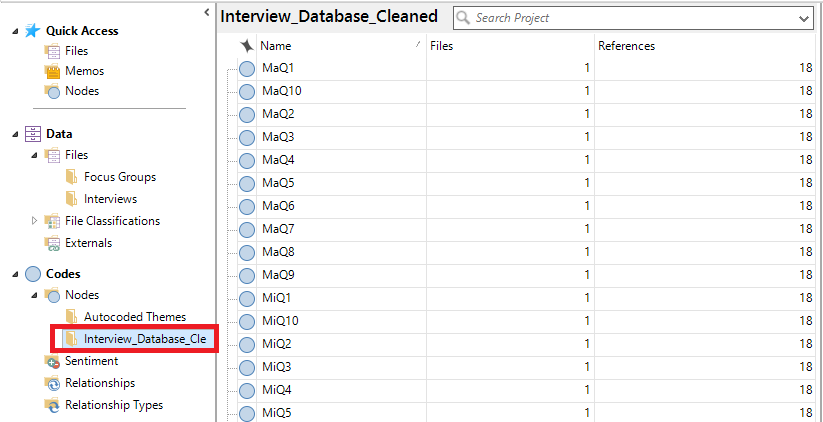
16. Next click on the Interview_Dataset_Cleaned folder to explore the nodes that were autogenerated for each question.
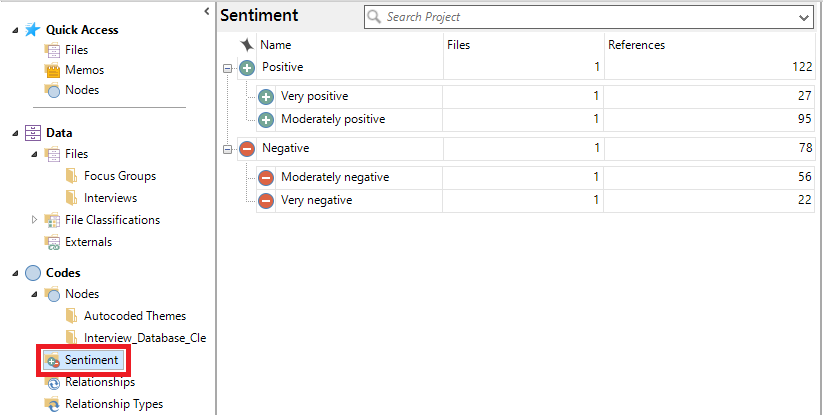
17. Finally, click on the Sentiment folder under Codes, to explore the positive and negative nodes and references. For any newly created Node, you can double click on it to see the references.
Resources to Learn More
Visit ourGetting Startedpage for more information, tutorials, and workshops on NVivo 12!
Check out this NVivo help page to explore all the file types you can import into an NVivo project.
Technique: Qualitative Data Analysis | Tools: NVivoDate Created: 2023-03-10Updated: 2023-04-11