Graphs and Maps
# Load graphing package ggplot2
library(ggplot2)
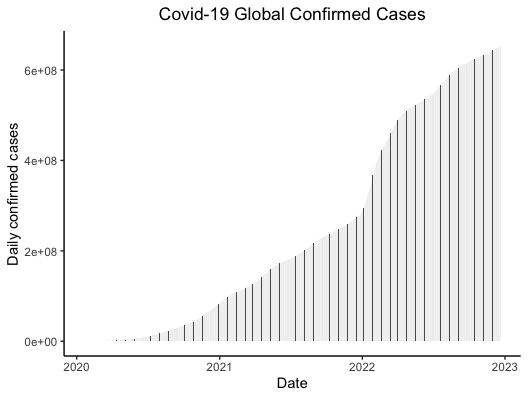
# Barchart of confirmed cases over time - World
ggplot(world, aes(x=date, y=confirmed)) +
  geom_bar(stat="identity", width=0.1) +
  theme_classic() +
  labs(title = "Covid-19 Global Confirmed Cases", x= "Date", y= "Daily confirmed cases") +
  theme(plot.title = element_text(hjust = 0.5))
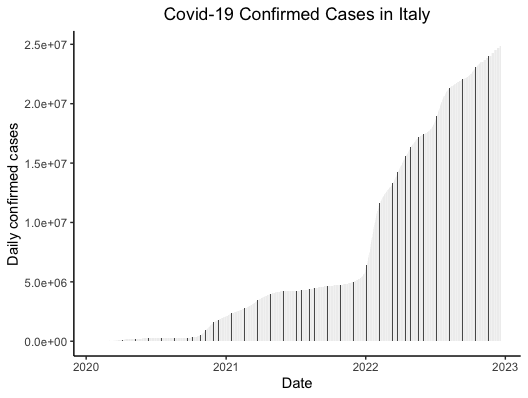
# Barchart of confirmed cases over time - Italy
ggplot(italy, aes(x=date, y=confirmed)) + geom_bar(stat="identity", width=0.1) +
  theme_classic() +
  labs(title = "Covid-19 Confirmed Cases in Italy", x= "Date", y= "Daily confirmed cases") +
  theme(plot.title = element_text(hjust = 0.5))
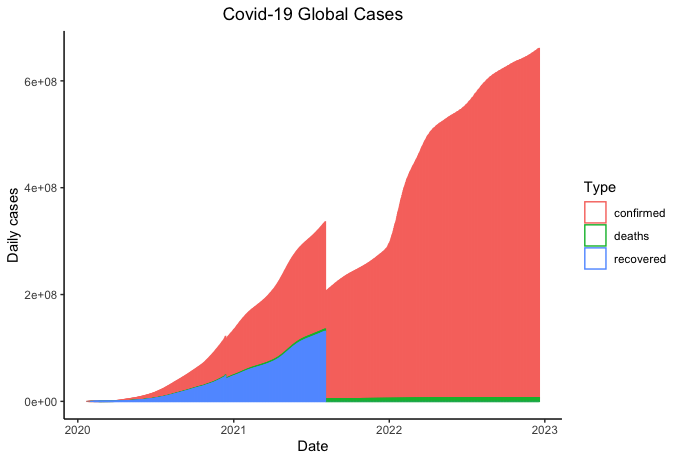
# Line graph of confirmed cases, deaths and recovered - World
str(world)
world %>% select(-cumconfirmed) %>% gather("Type", "Cases", -c(date, days)) %>%
ggplot(aes(x=date, y=Cases, colour=Type)) + geom_bar(stat="identity", width=0.2, fill="white") +
  theme_classic() +
  labs(title = "Covid-19 Global Cases", x= "Date", y= "Daily cases") +
  theme(plot.title = element_text(hjust = 0.5))
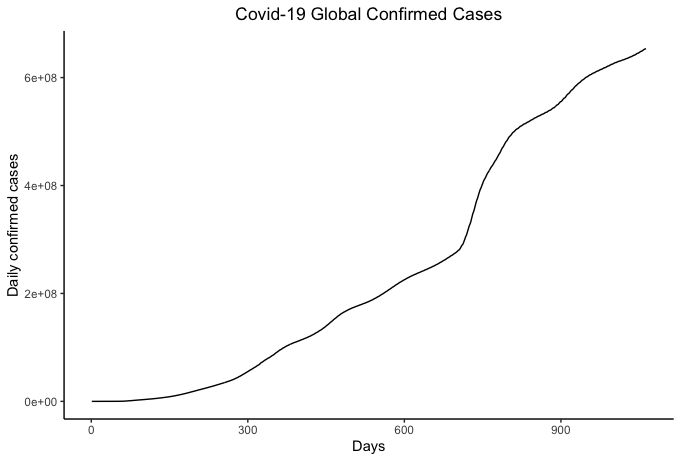
# Line graph of confirmed cases over time - World
ggplot(world, aes(x=days, y=confirmed)) + geom_line() +
  theme_classic() +
  labs(title = "Covid-19 Global Confirmed Cases", x= "Days", y= "Daily confirmed cases") +
  theme(plot.title = element_text(hjust = 0.5))
# Ignore warning
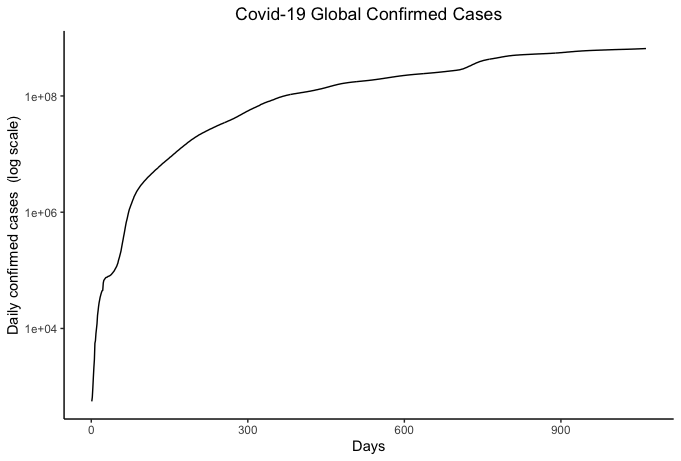
# Line graph of confirmed cases over time (log10 scale) - World
ggplot(world, aes(x=days, y=confirmed)) + geom_line() +
  theme_classic() +
  labs(title = "Covid-19 Global Confirmed Cases", x= "Days", y= "Daily confirmed cases  (log scale)") +
  theme(plot.title = element_text(hjust = 0.5)) +
  scale_y_continuous(trans="log10")
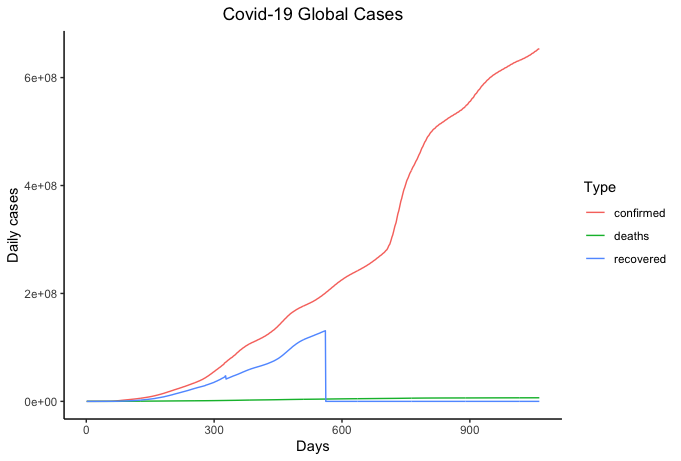
# Line graph of confirmed cases, deaths and recovered - World
str(world)
world %>% select(-cumconfirmed) %>% gather("Type", "Cases", -c(date, days)) %>%
ggplot(aes(x=days, y=Cases, colour=Type)) + geom_line() +
  theme_classic() +
  labs(title = "Covid-19 Global Cases", x= "Days", y= "Daily cases") +
  theme(plot.title = element_text(hjust = 0.5))
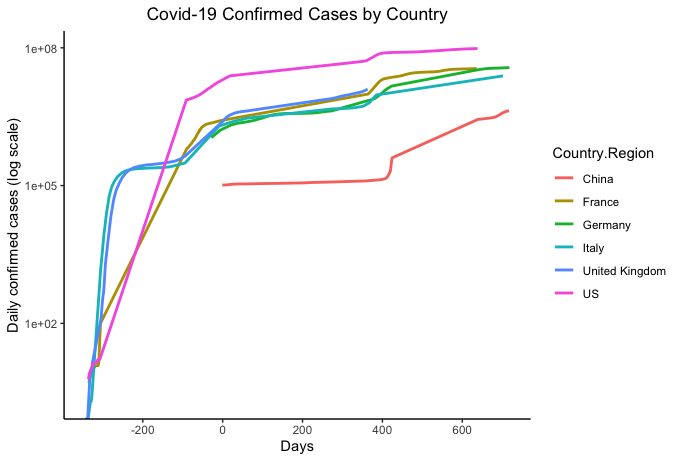
# Line graph of confirmed cases on log10 scale for select countries
countryselection <- country %>% filter(Country.Region==c("US", "Italy", "China", "France", "United Kingdom", "Germany"))
ggplot(countryselection, aes(x=days, y=confirmed, colour=Country.Region)) + geom_line(size=1) +
  theme_classic() +
  labs(title = "Covid-19 Confirmed Cases by Country", x= "Days", y= "Daily confirmed cases (log scale)") +
  theme(plot.title = element_text(hjust = 0.5)) +
  scale_y_continuous(trans="log10")
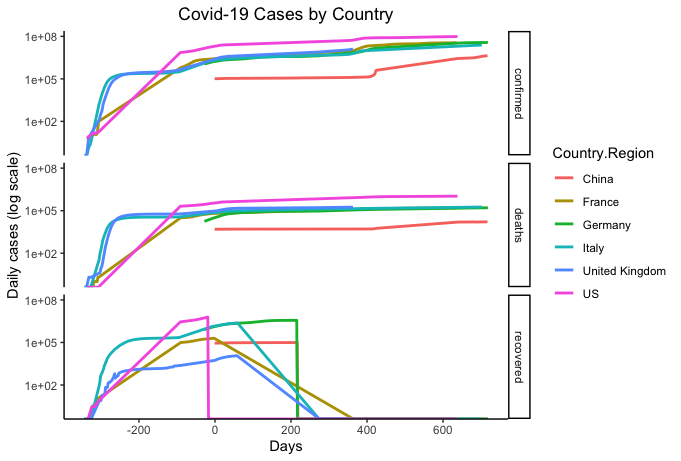
# Matrix of line graphs of confirmed, deaths and recovered for select countries in log10 scale
str(countryselection)
countryselection %>% select(-cumconfirmed) %>% gather("Type", "Cases", -c(date, days, Country.Region)) %>%
ggplot(aes(x=days, y=Cases, colour=Country.Region)) + geom_line(size=1) +
  theme_classic() +
  labs(title = "Covid-19 Cases by Country", x= "Days", y= "Daily cases (log scale)") +
  theme(plot.title = element_text(hjust = 0.5)) +
  scale_y_continuous(trans="log10") +
  facet_grid(rows=vars(Type))
MAPS
## Map
countrytotal <- country %>% group_by(Country.Region) %>% summarize(cumconfirmed=sum(confirmed), cumdeaths=sum(deaths), cumrecovered=sum(recovered))
# Basemap from package tmap
library(tmap)
data(World)
class(World)
# Combine basemap data to covid data
countrytotal$Country.Region[!countrytotal$Country.Region %in% World$name]
list <- which(!countrytotal$Country.Region %in% World$name)
countrytotal$country <- as.character(countrytotal$Country.Region)
countrytotal$country[list] <-
  c("Andorra", "Antigua and Barbuda", "Bahrain",
    "Barbados", "Bosnia and Herz.", "Myanmar",
    "Cape Verde", "Central African Rep.", "", "Congo",
    "Dem. Rep. Congo", "Czech Rep.", "Diamond Princess",
    "Dominica", "Dominican Rep.", "Eq. Guinea",
    "Swaziland", "Grenada", "Holy See", "", "Dem. Rep. Korea",
    "Korea", "Lao PDR", "Liechtenstein",
    "Maldives", "Malta", "", "Mauritius","",
    "Monaco", "MS Zaandam", "", "Macedonia", "",
    "Saint Kitts and Nevis", "Saint Lucia", "Saint Vincent and the Grenadines",
    "", "San Marino", "Sao Tome and Principe", "Seychelles",
    "Singapore", "Solomon Is.", "S. Sudan", "", "Taiwan", "", "",
    "United States", "Palestine", "")
countrytotal$Country.Region[!countrytotal$country %in% World$name]
World$country <- World$name
worldmap <- left_join(World, countrytotal, by="country")
worldmap$cumconfirmed[is.na(worldmap$cumconfirmed)] <- 0
# Map
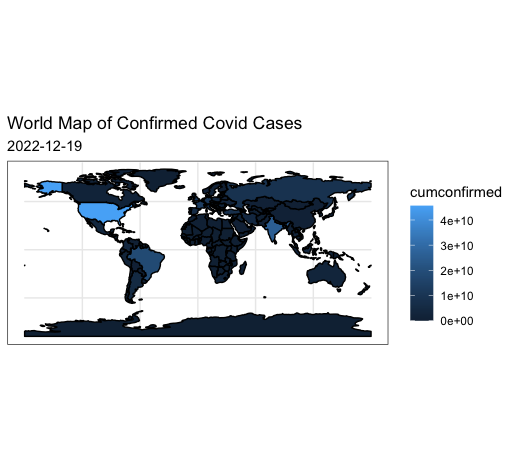
ggplot(data = worldmap) + geom_sf(aes(fill=cumconfirmed), color="black") +
ggtitle("World Map of Confirmed Covid Cases",
subtitle=max(country$date))
theme_bw()
Tools: R | Data Format: Statistics