TDM Studio Visualizations
Logging in
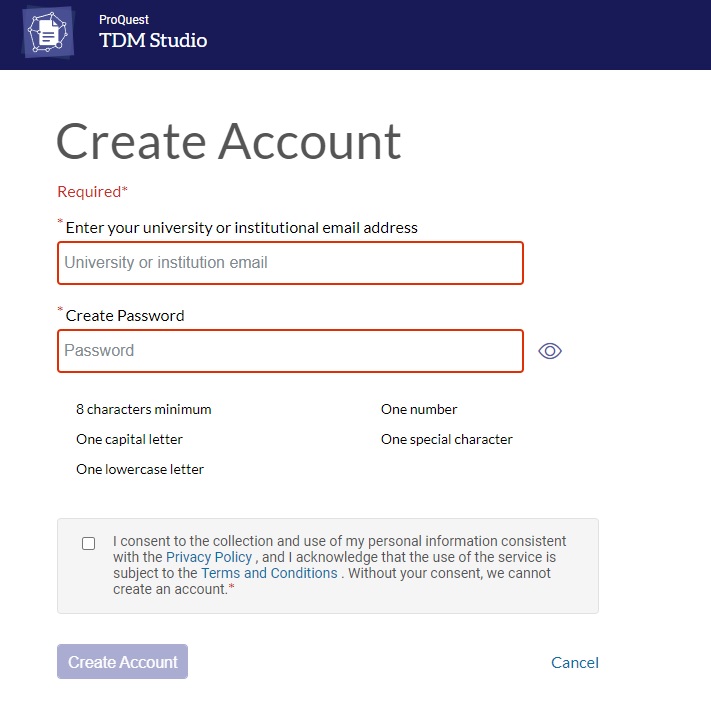
Create an account with ProQuest. Note: in order to gain access to licensed UofT collections you must use your UTORONTO email address in the form (@mail.utoronto.ca, @utoronto.ca, @rotman.utoronto.ca, etc.) This account will provide you with access to both Visualizations and Workbench.
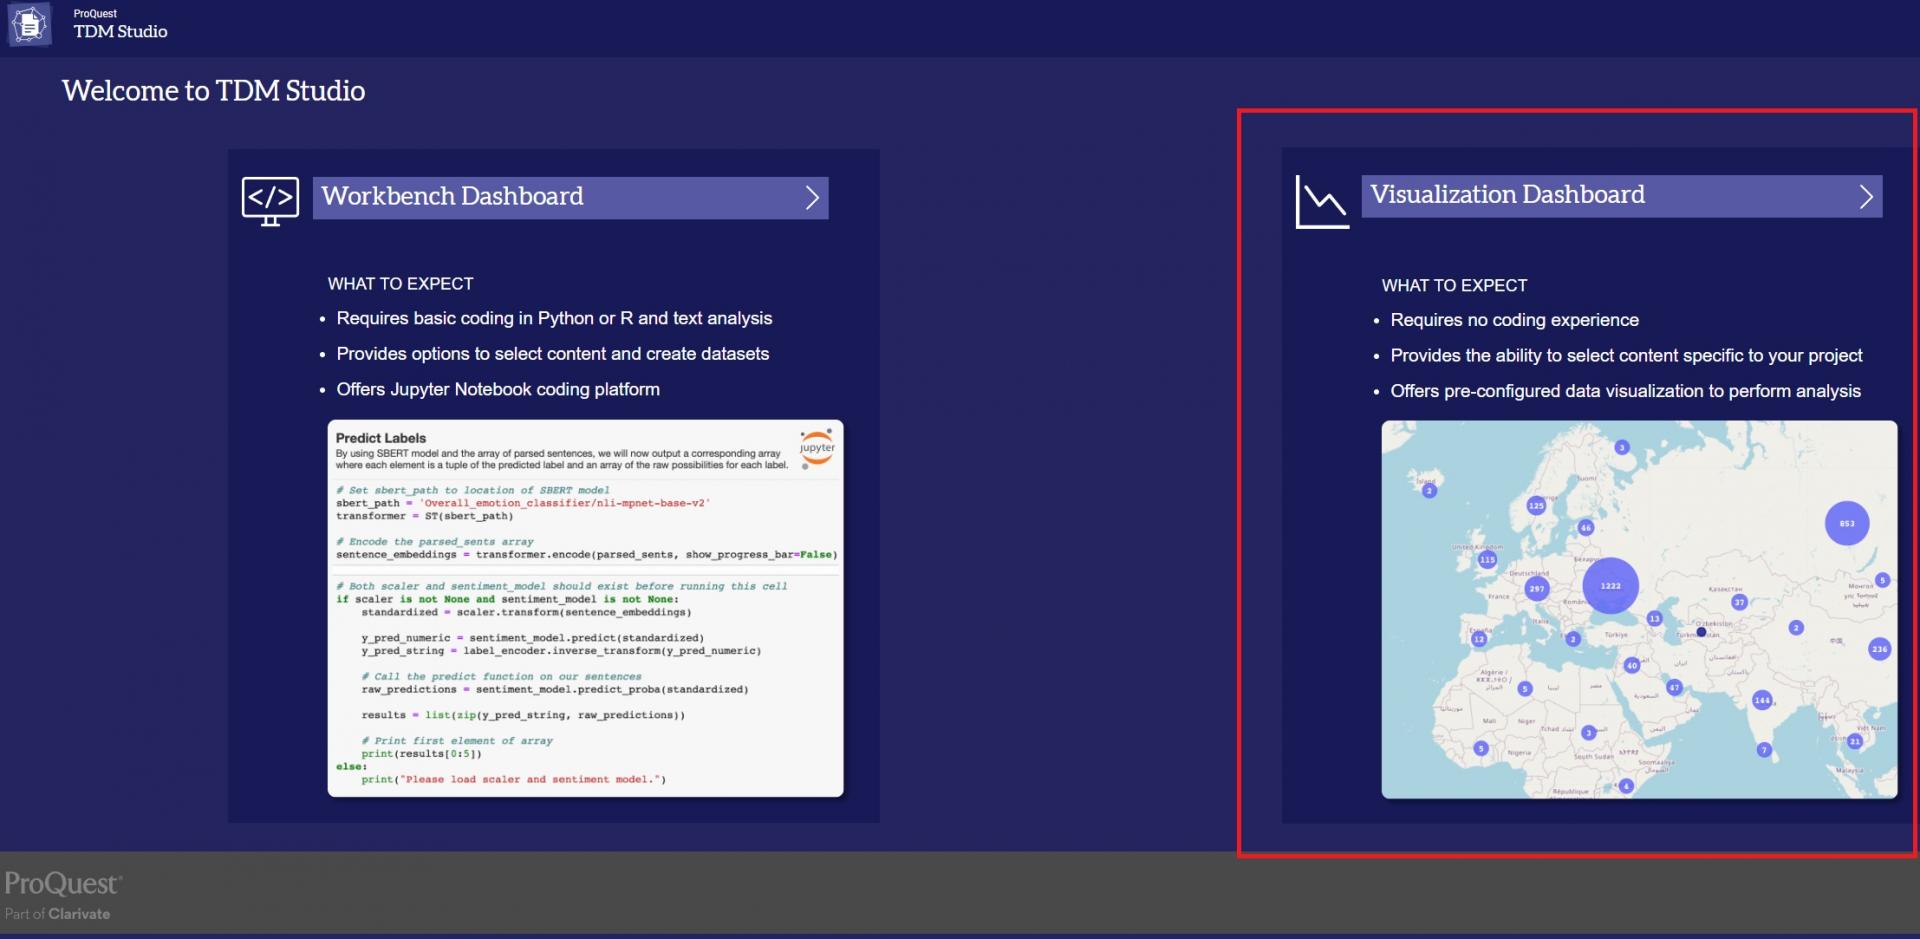
Once you have created your account and successfully logged in, select Visualizations Dashboard from the main login screen.
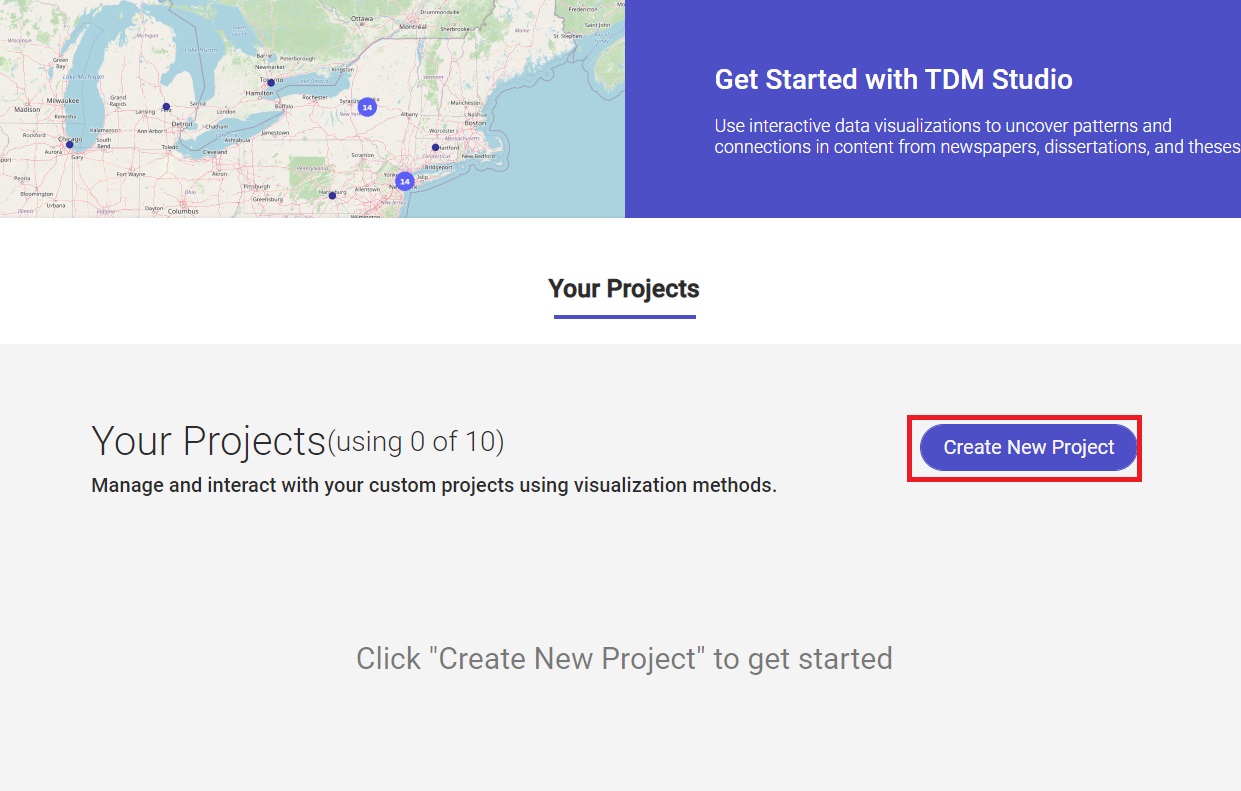
Creating a Project and Running Algorithms
Once logged in, you can build collections of texts called “projects” that can then be analyzed in your browser using TDM Studio visualizations. Visualizations allows you to manage as many as five simultaneous research projects of 10,000 documents each.
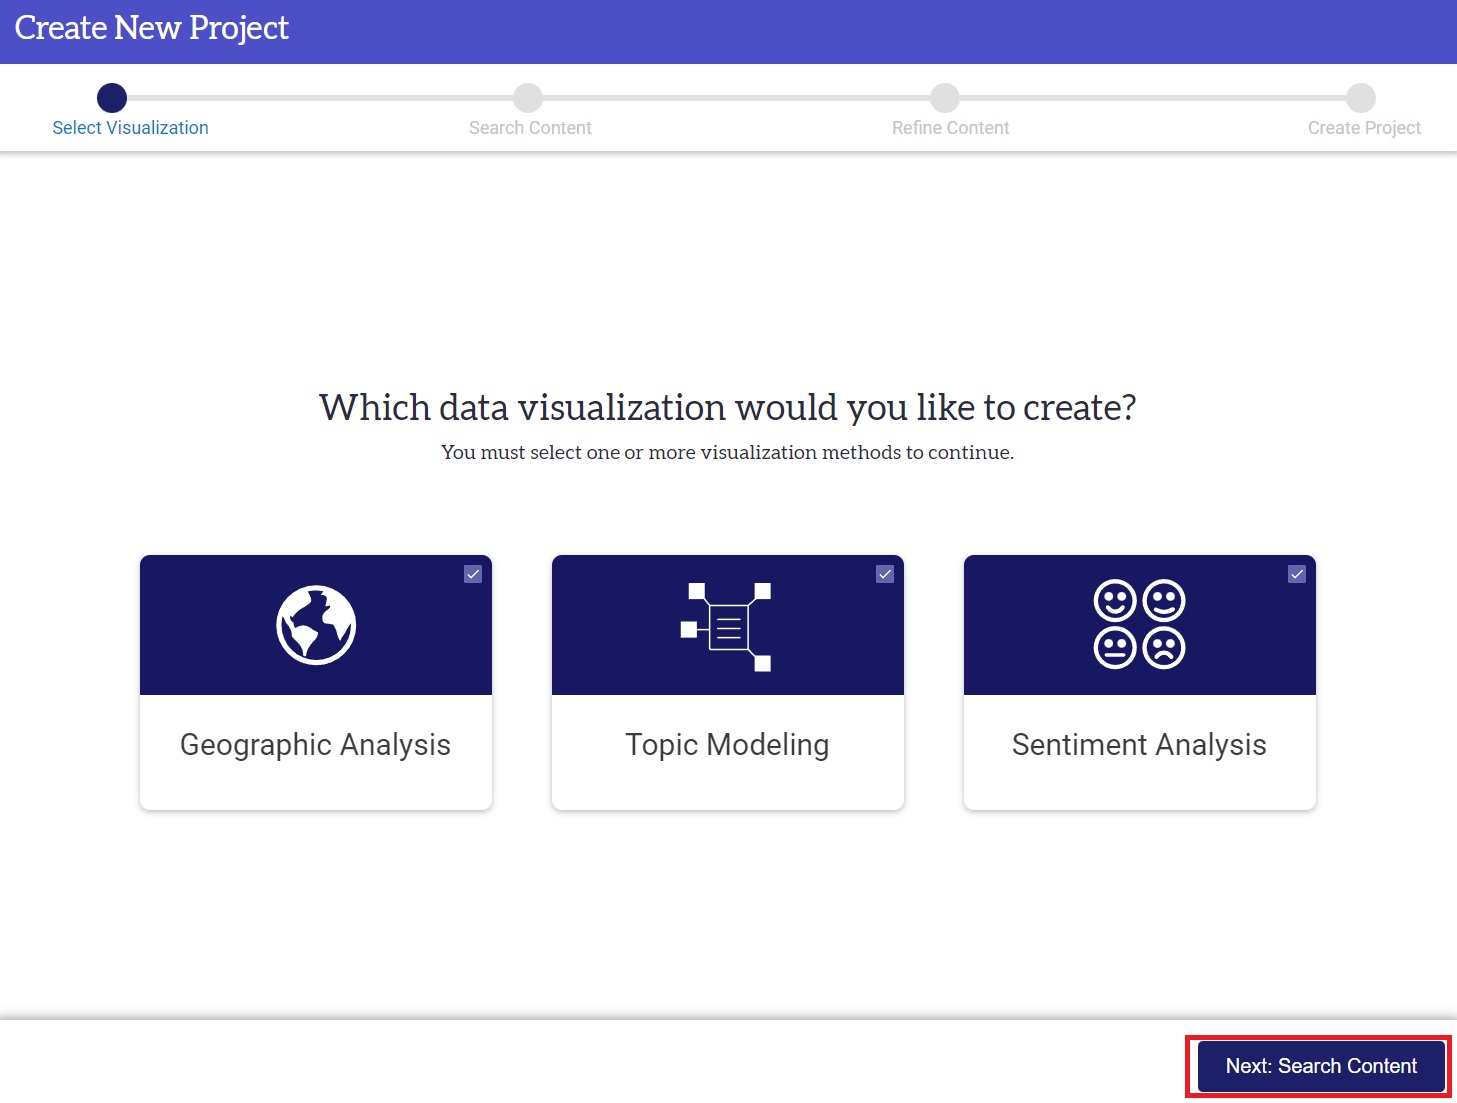
Before searching Proquest’s databases, you’ll need to select which pre-built algorithms you’d like to apply to your search results. Visualizations currently supports Topic Modelling, Geographic Analysis, and Sentiment Analysis, although there are plans to add additional algorithms based on demand. Note that it is currently not possible to customize these algorithms.
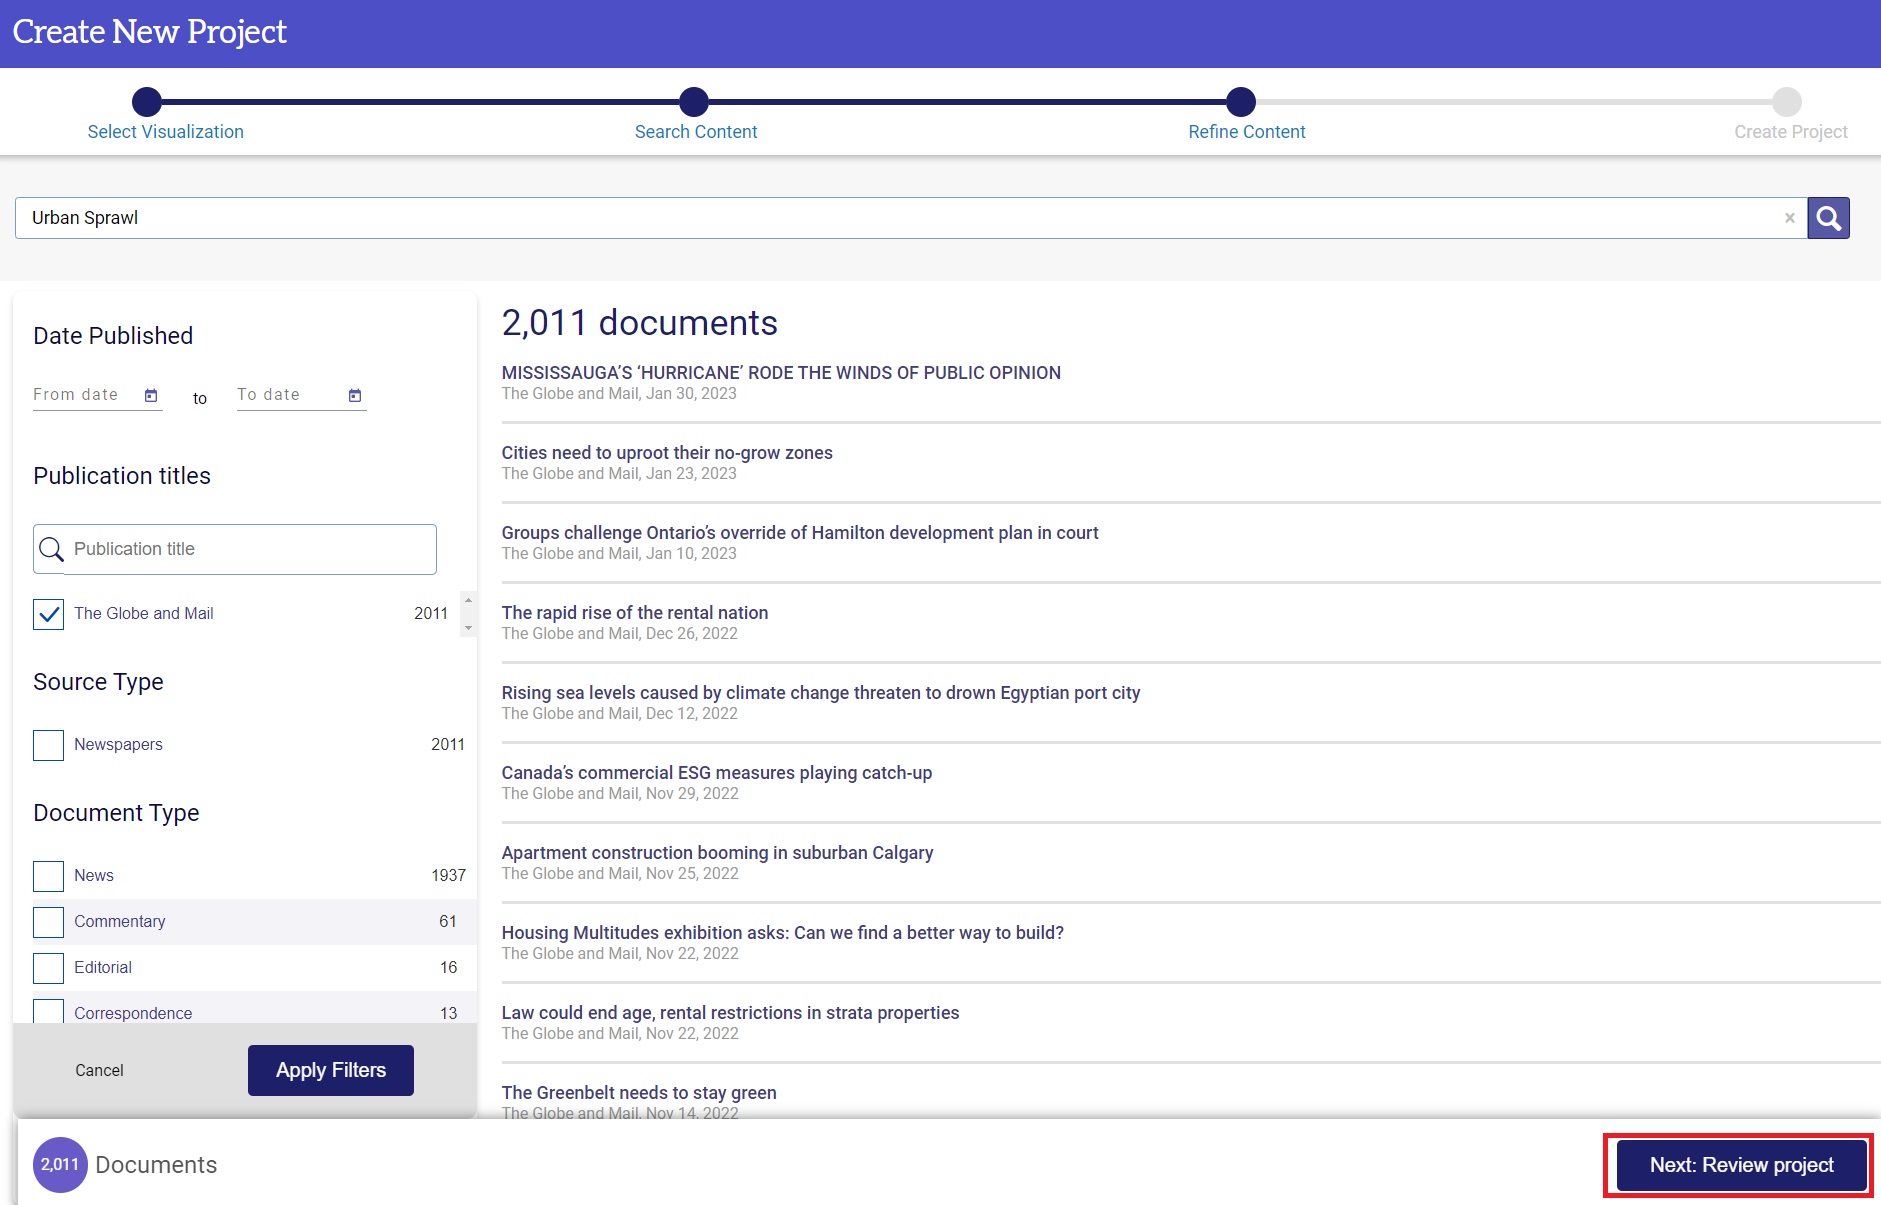
Once you’ve selected your algorithms, search and refined your search results to under 10,000 records, then select “Review Content”.
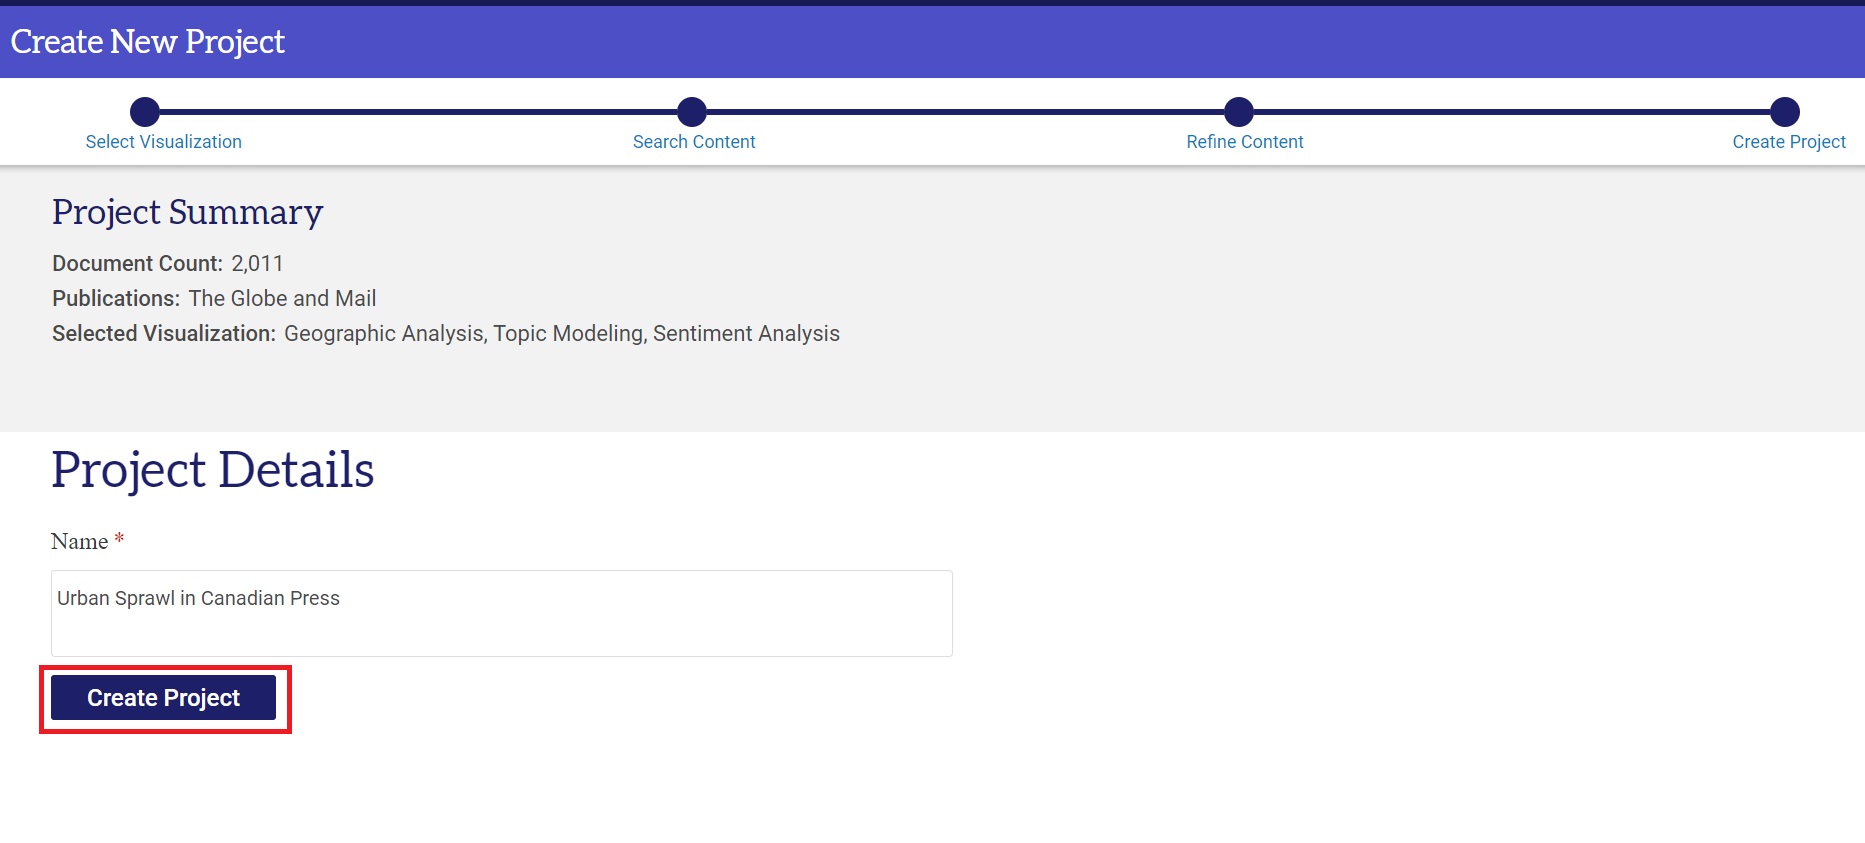
You will be asked to provide your dataset a name, then click “Create project”.
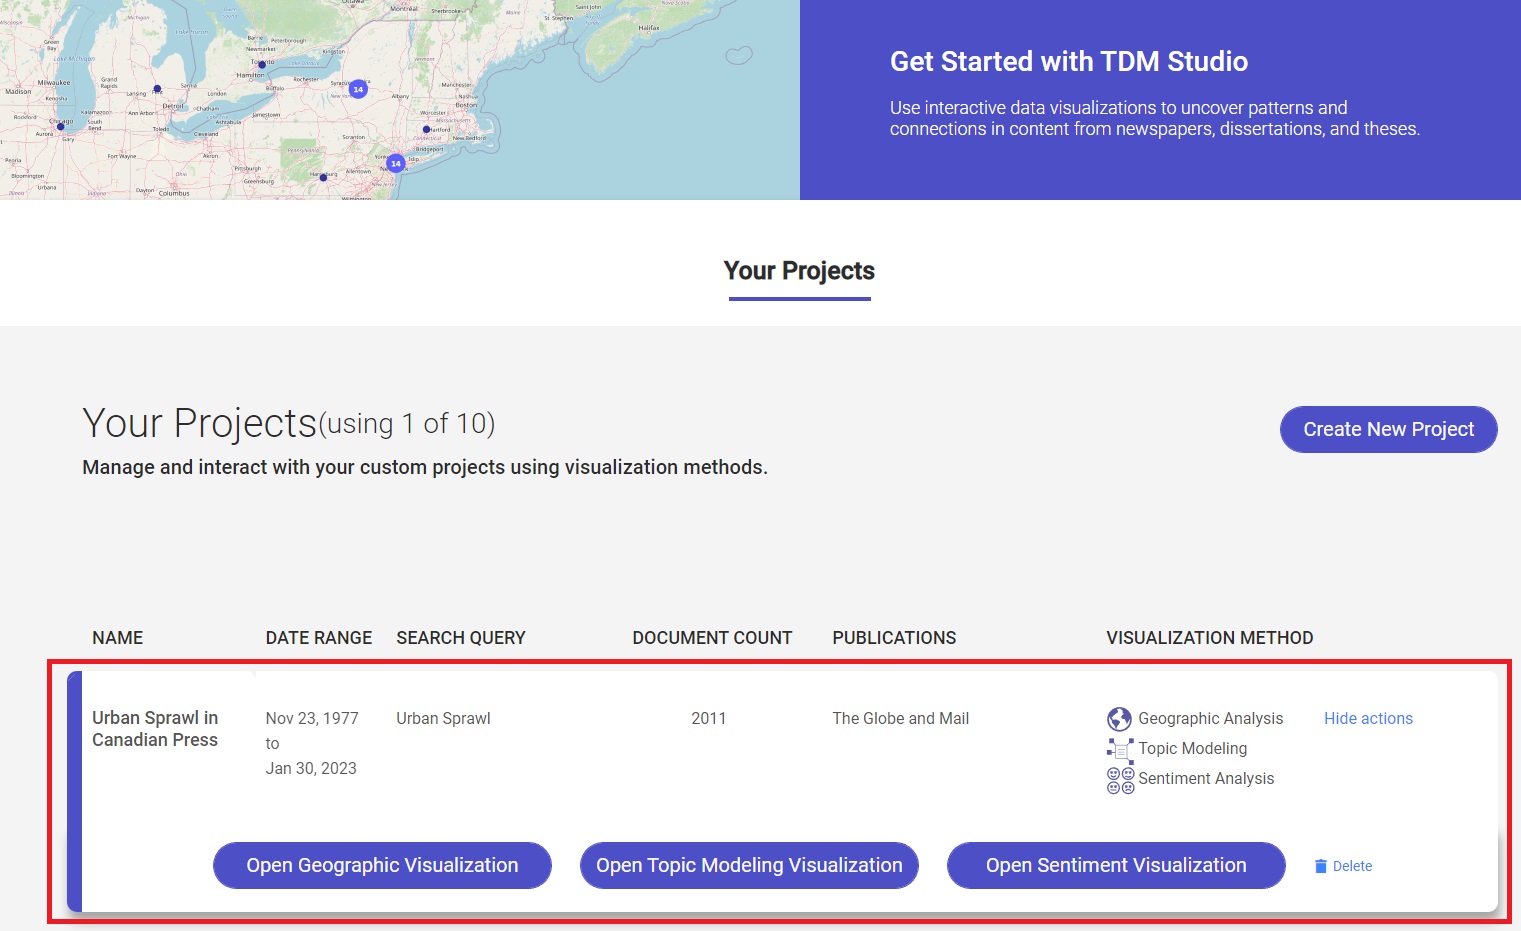
Your dataset will now be visible in your TDM Studio Visualizations Dashboard. Note that the algorithms you selected will be greyed-out initially, until processing is complete. Processing may take several hours depending on the size of your dataset and the analyses selected.
Once processing is complete, you will be able to select and explore your visualizations. The underlying data can be downloaded as zipped CSV files or GeoJSON (geographic analysis only).
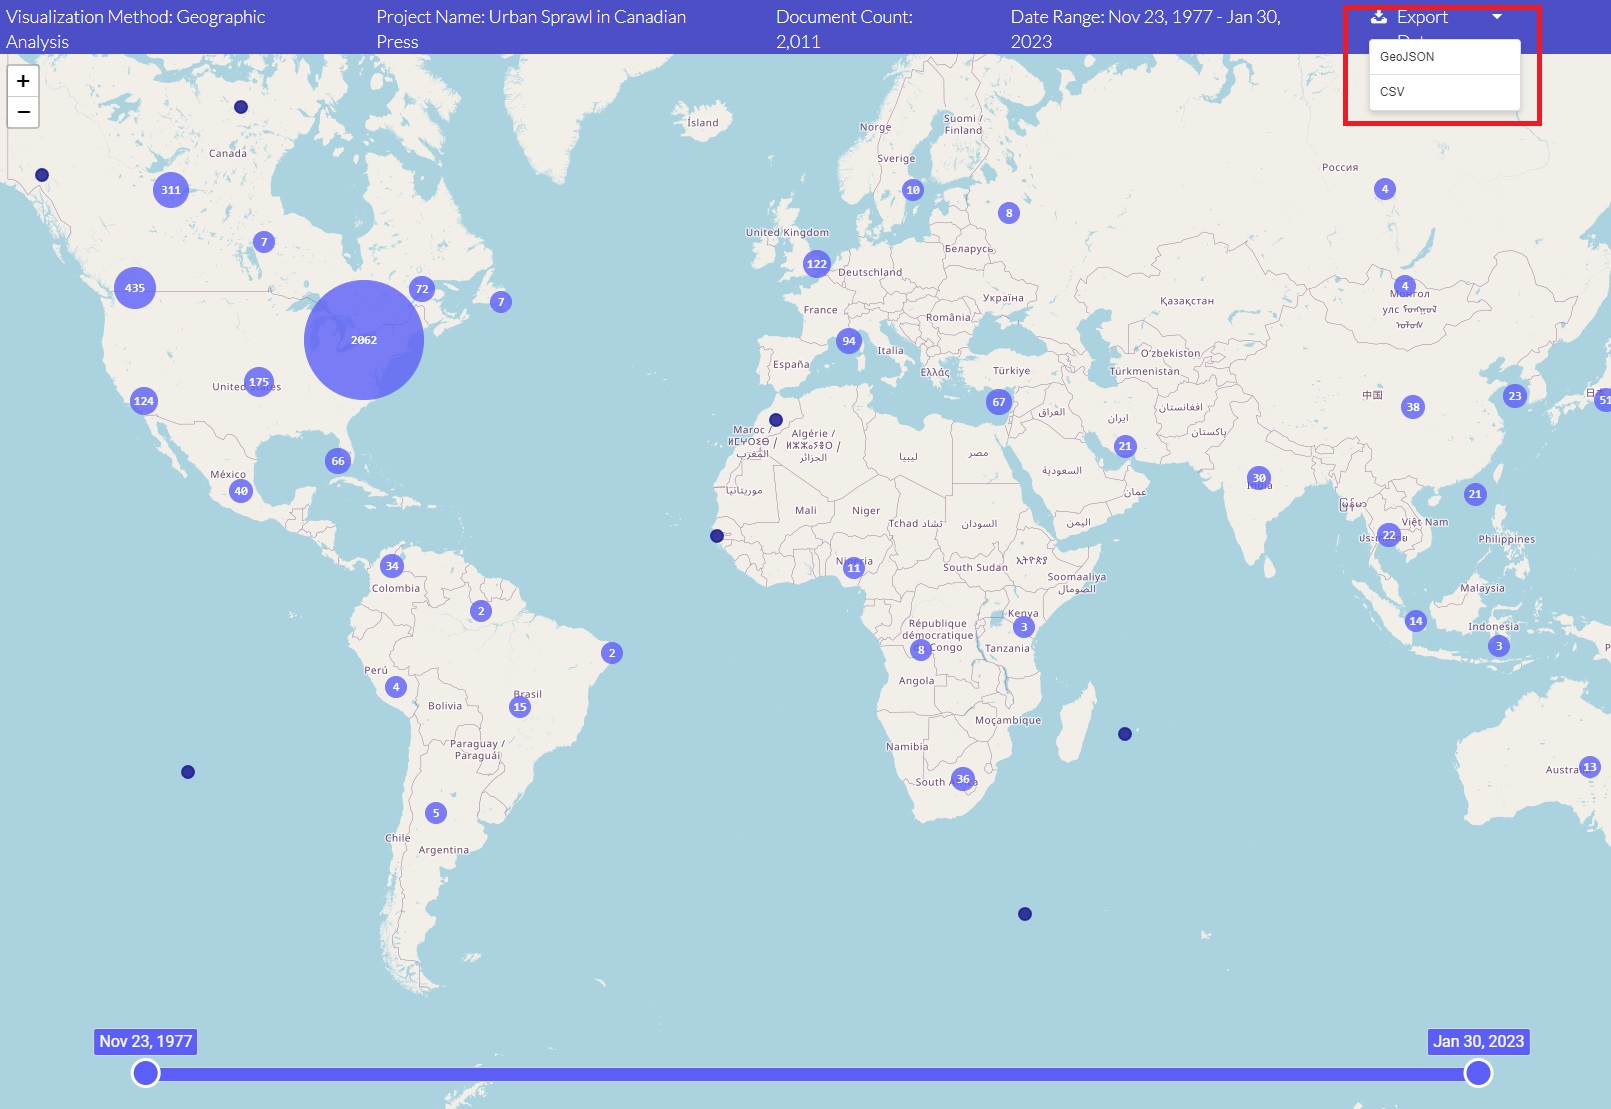
All zips includes CSV of basic metadata for each record (such as ID, Title, Publication, Date). While there is not currently an option to download visualizations as images, they can be manually saved as screenshots.
Read this short ProQuest guide for more information on creating a project.
A note on corpus: As of January 2025, TDM Studio Visualizations now includes the vast majority of UofT’s licensed content. Previously, only a small subset of content had been available so this may impact datasets created prior to 2025. For a complete list of databases currently accessible via Visualizations, please contact the Map & Data Library.
Technique: Text and Data Mining | Tools: ProQuest TDM Studio