Open source web map creation with qgis2web and GitHub Pages

If you’d like to publicly share an interactive visualization based on your spatial data, qgis2web provides a quick and easy way to do this. The underlying HTML, CSS, and JavaScript code of your web map can then be endlessly customized if you have web development skills or would like to learn them.
This tutorial makes use of three different development tools:
QGIS is a free, open source GIS desktop application that runs on Windows, MacOS, and Linux. If you’re new to QGIS, please see the Map and Data Library’s introductory QGIS tutorial before proceeding. QGIS 3.44 in Windows is used in this example, but the process will be very similar with other versions of the software or other operating systems. The qgis2web plugin will be added to your installation of QGIS and used to create the web map.
Leaflet is an open source mapping library for the JavaScript programming language, which is one of the core technologies underlying modern websites. Leaflet is a beginner-friendly option for creating custom interactive web maps.
GitHub is a web platform that allows users to share code and other data. Code uploaded to your GitHub account can be turned into a live website using a feature called GitHub Pages. We recommend this as a reliable way to host digital content at no cost.
Because you’re using free and/or open source tools, you’ll have complete control over your work and won’t be subject to the subscription or licensing restrictions you might find with proprietary software, such as ArcGIS.
You can follow the steps of this tutorial using your own data. Alternatively, download and unzip the sample data (Toronto subway lines and stations) used in the examples here.
Set up QGIS: Install plugins
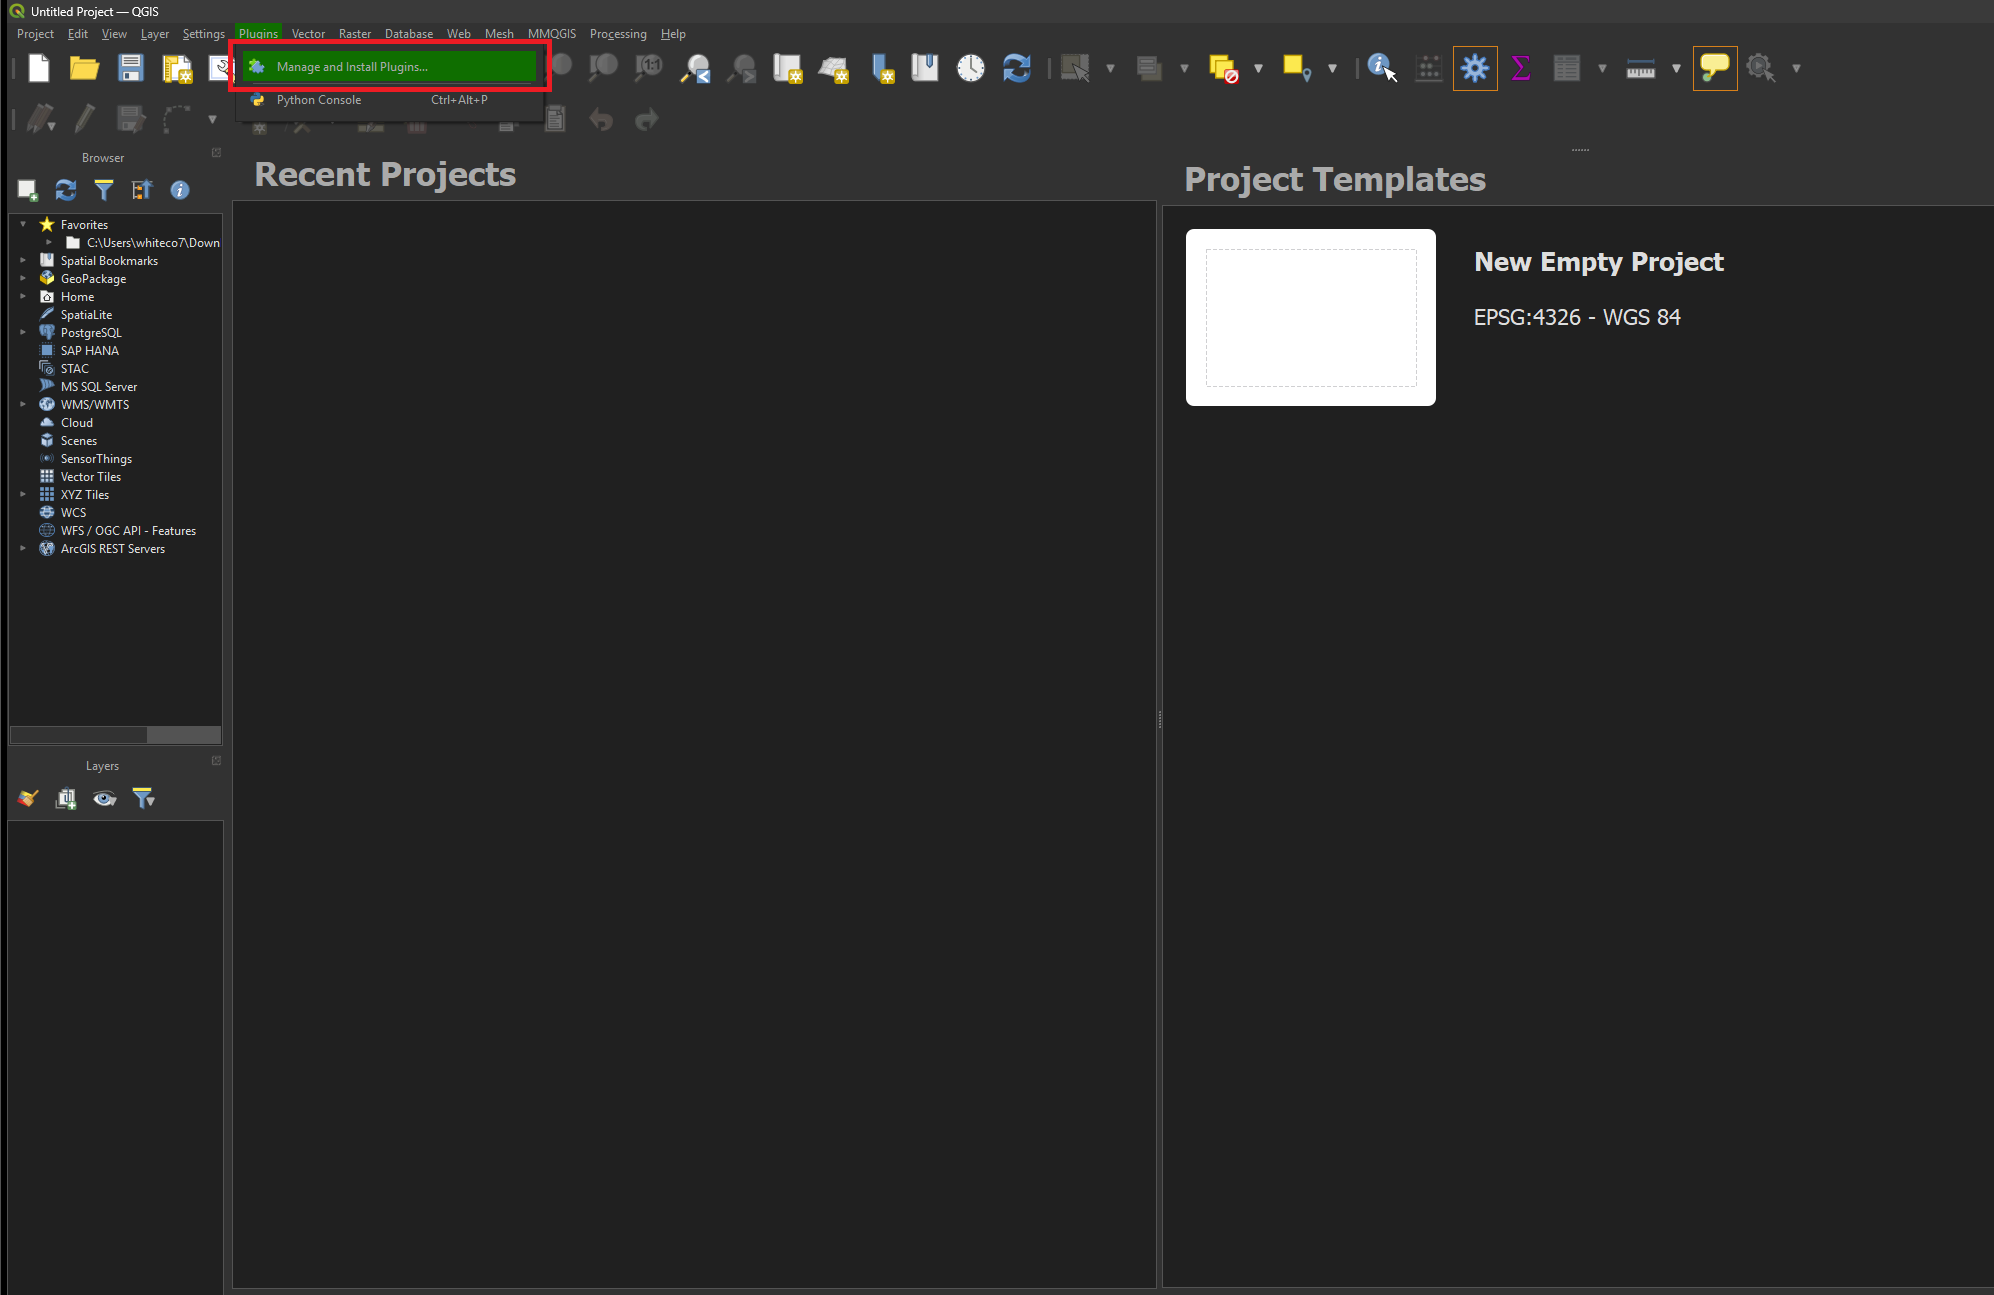
- Open QGIS. Click Plugins → Manage and install plugins.
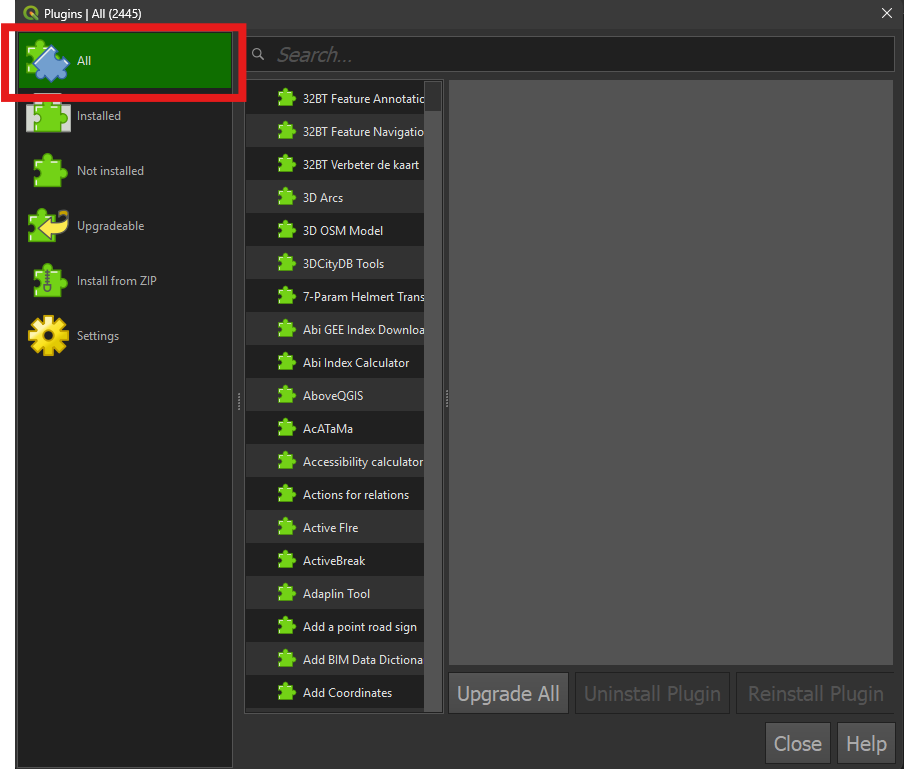
- Click the All tab to the left.
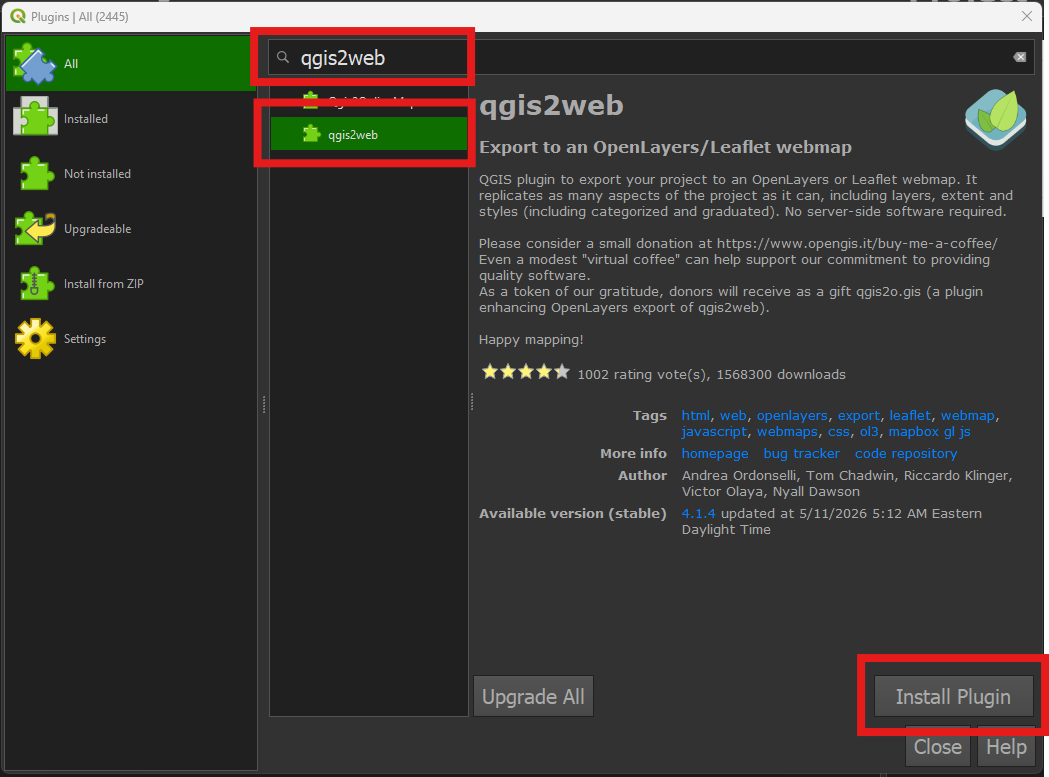
- Search for qgis2web. Click the qgis2web result, then click the Install plugin button.
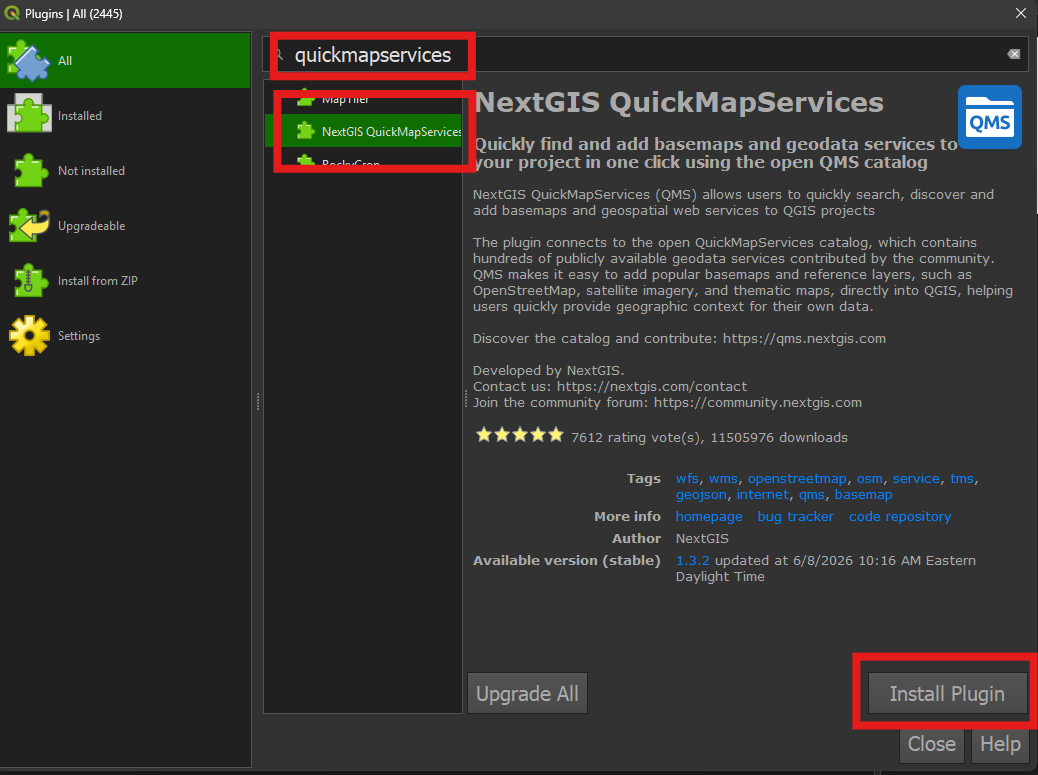
- Optional: Install the NextGIS QuickMapServices plugin. This tool makes it easy to add basemaps to your project. You don’t need this plugin to use qgis2web, but it will be helpful if you want to replicate the example shown in this tutorial.
Create and configure the QGIS project
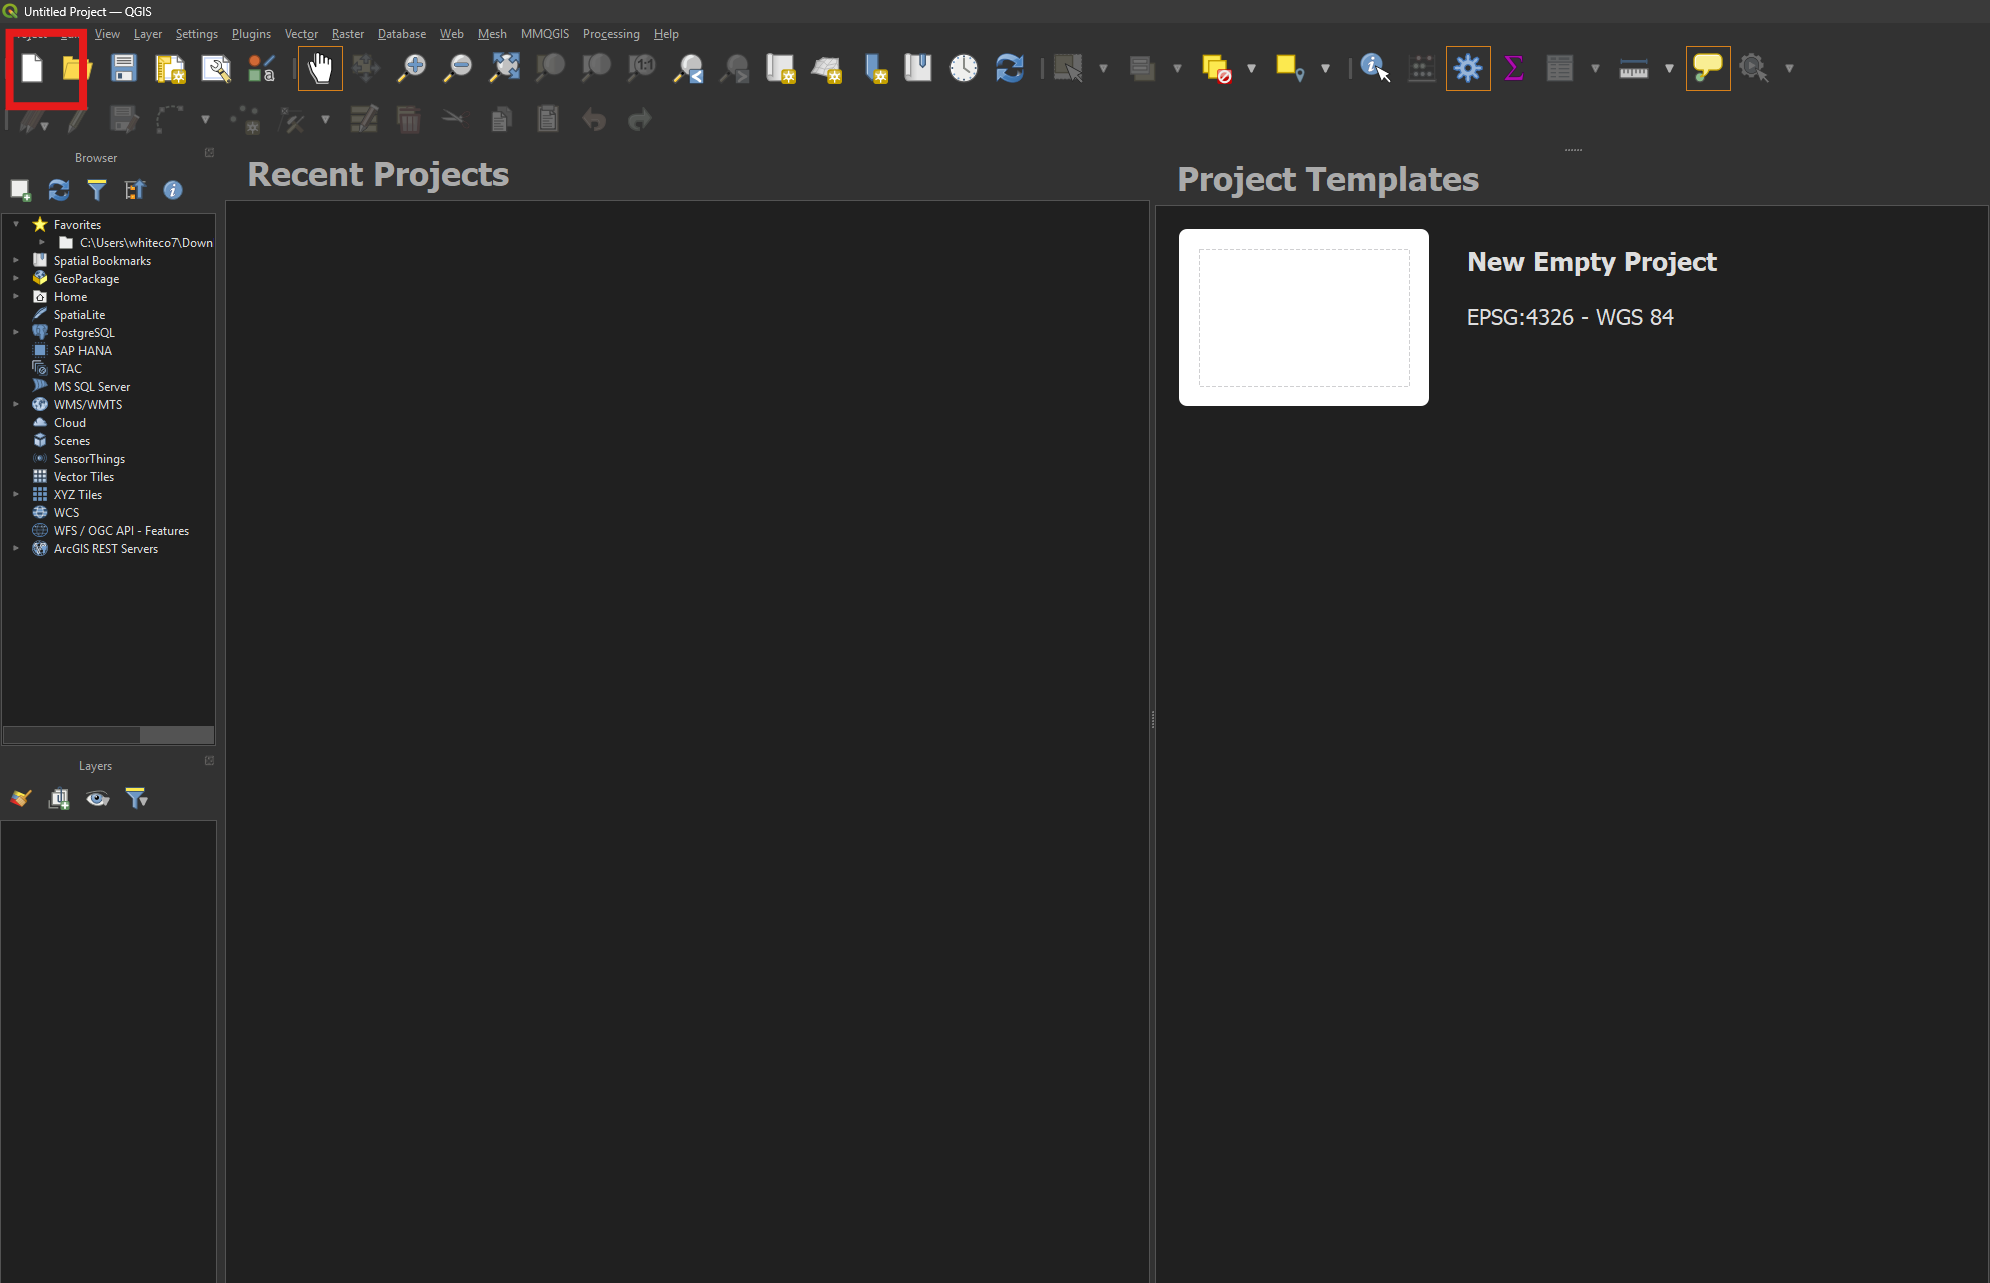
- In QGIS, click the New project button.
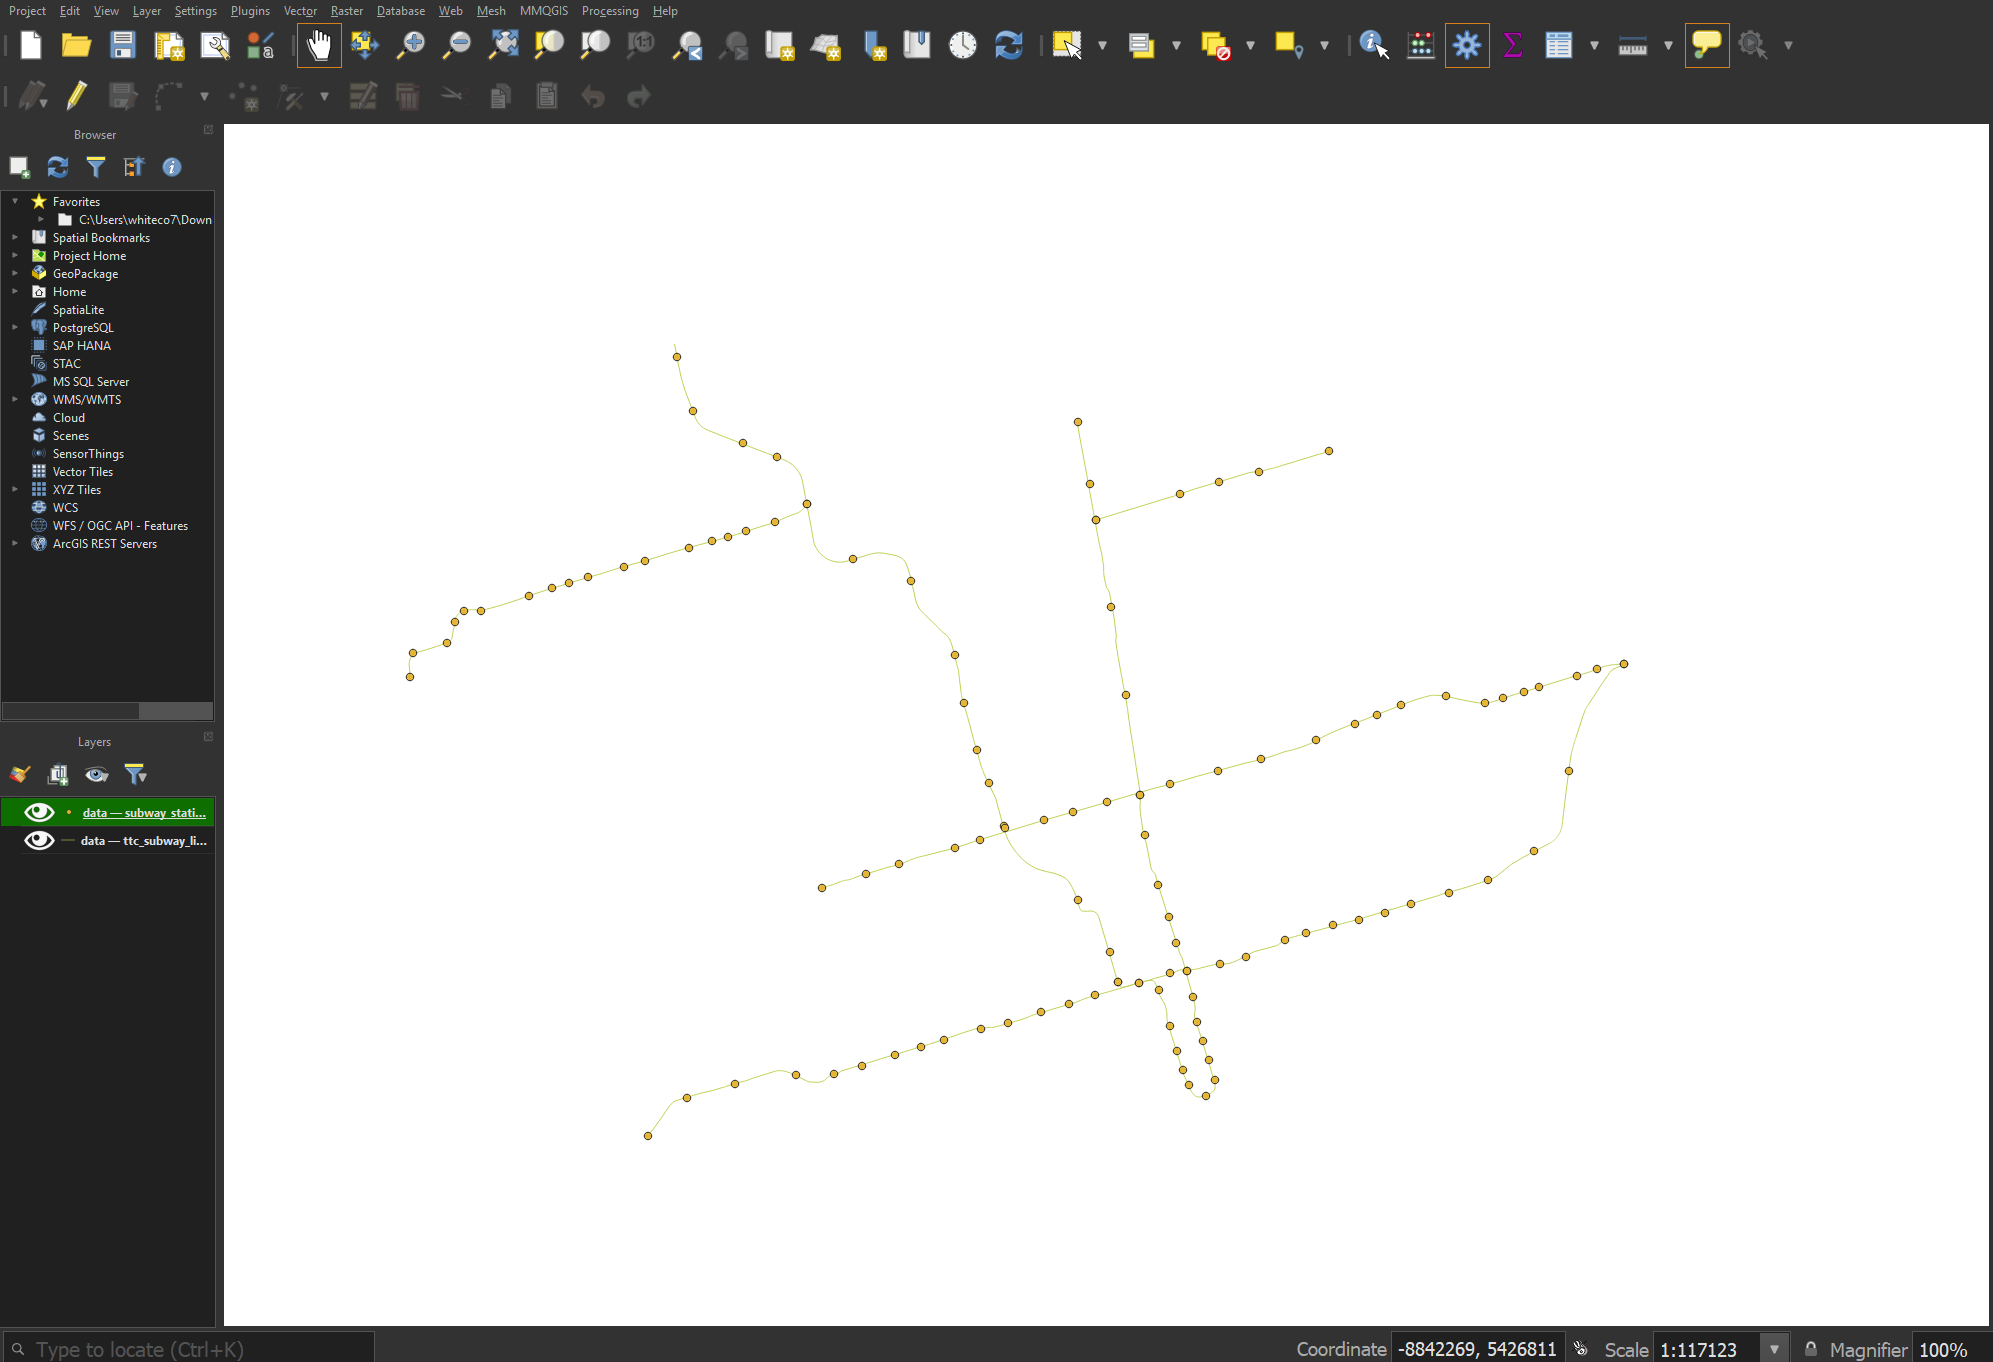
- Add your data layers to the map. (If you’re using the sample data, these will be found in data.gpkg.)
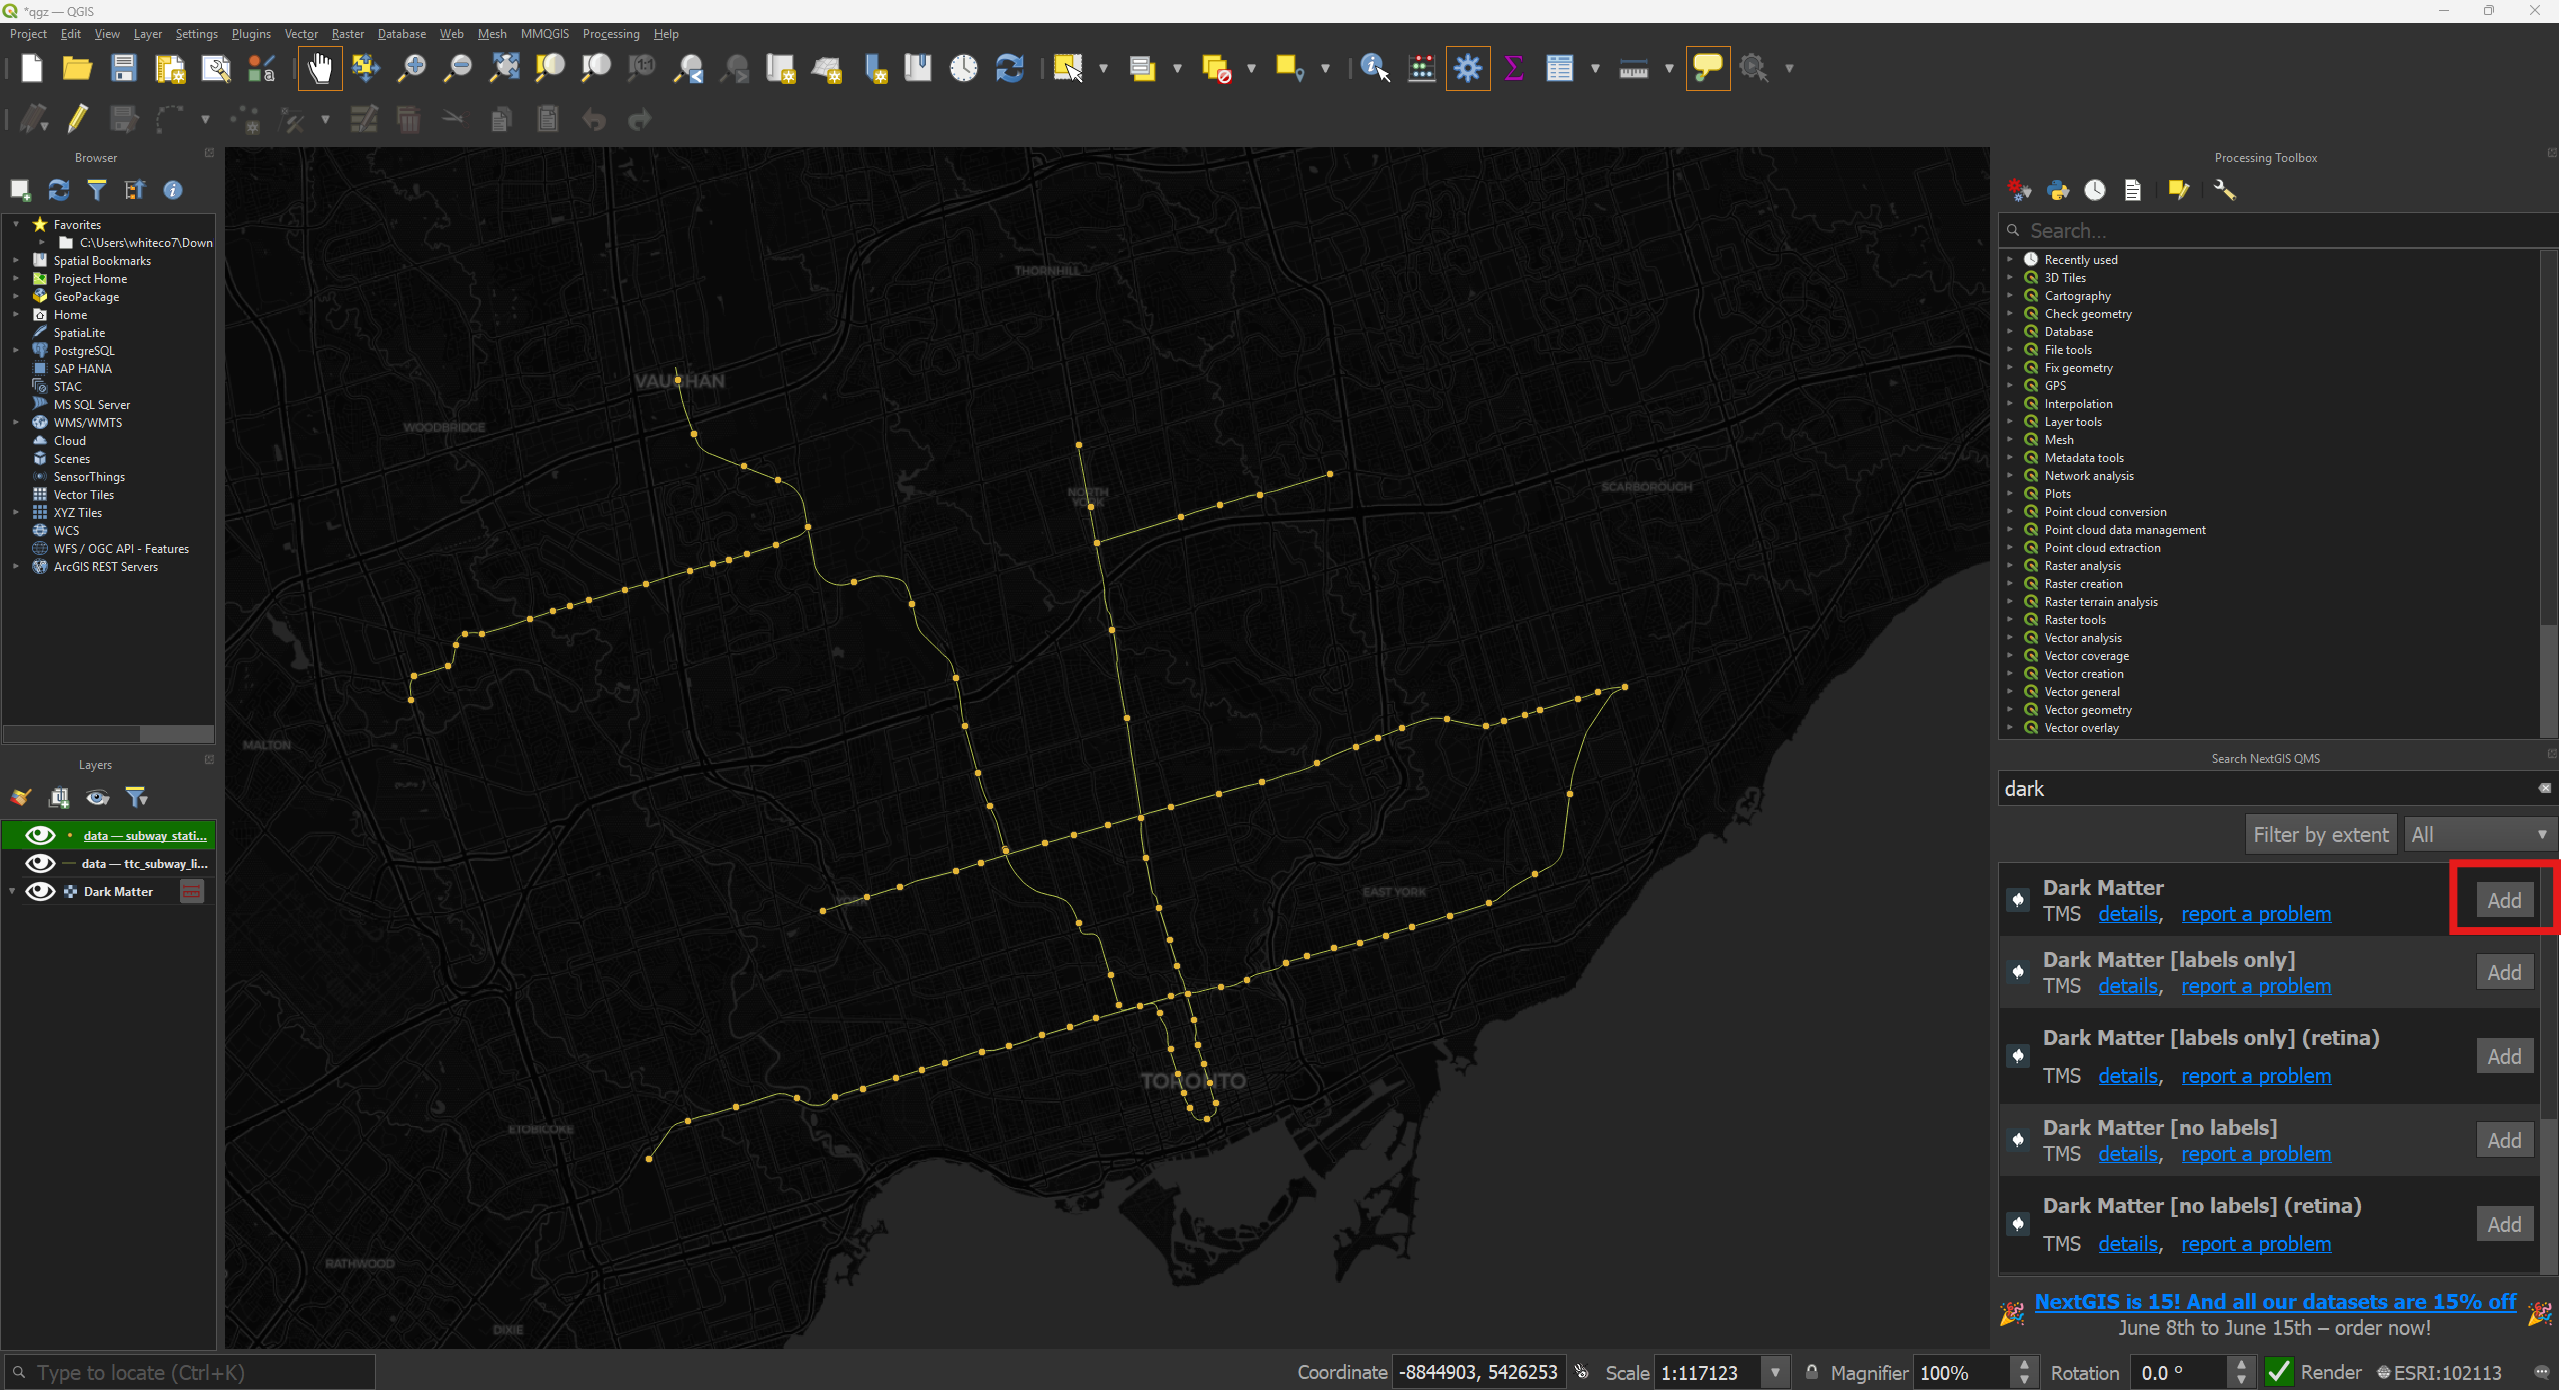
- Optionally, add a basemap. If you know the URL of the basemap you’d like to use, go to Layer → Add Layer → Add XYZ Layer and paste it in. Or, as shown in this example, use the QuickMapServices plugin.
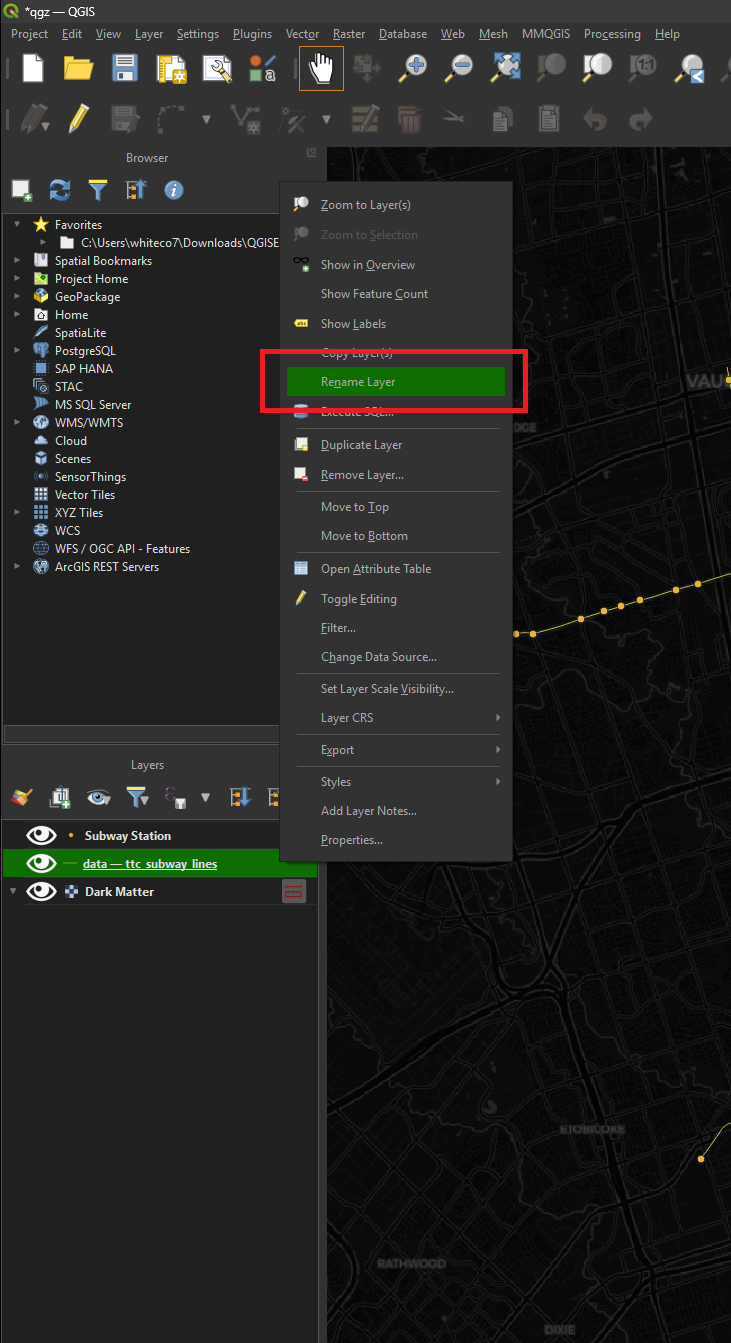
- In the Layers Panel, give your layers human-friendly names by right-clicking on their names and selecting Rename Layer. This is how their names will appear in the legend when your web map is published.
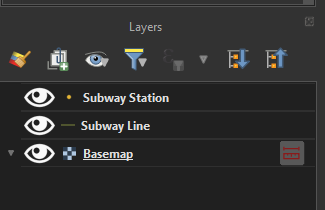
- Adjust your layers’ symbology to your liking. In this example, the subway lines use Categorized symbology, with ROUTE_NAME as the value field. The subway stations also use Categorized symbology, with Wheelchair Accessible as the value field. More information on symbology can be found in the Map and Data Library’s introductory QGIS tutorial here.
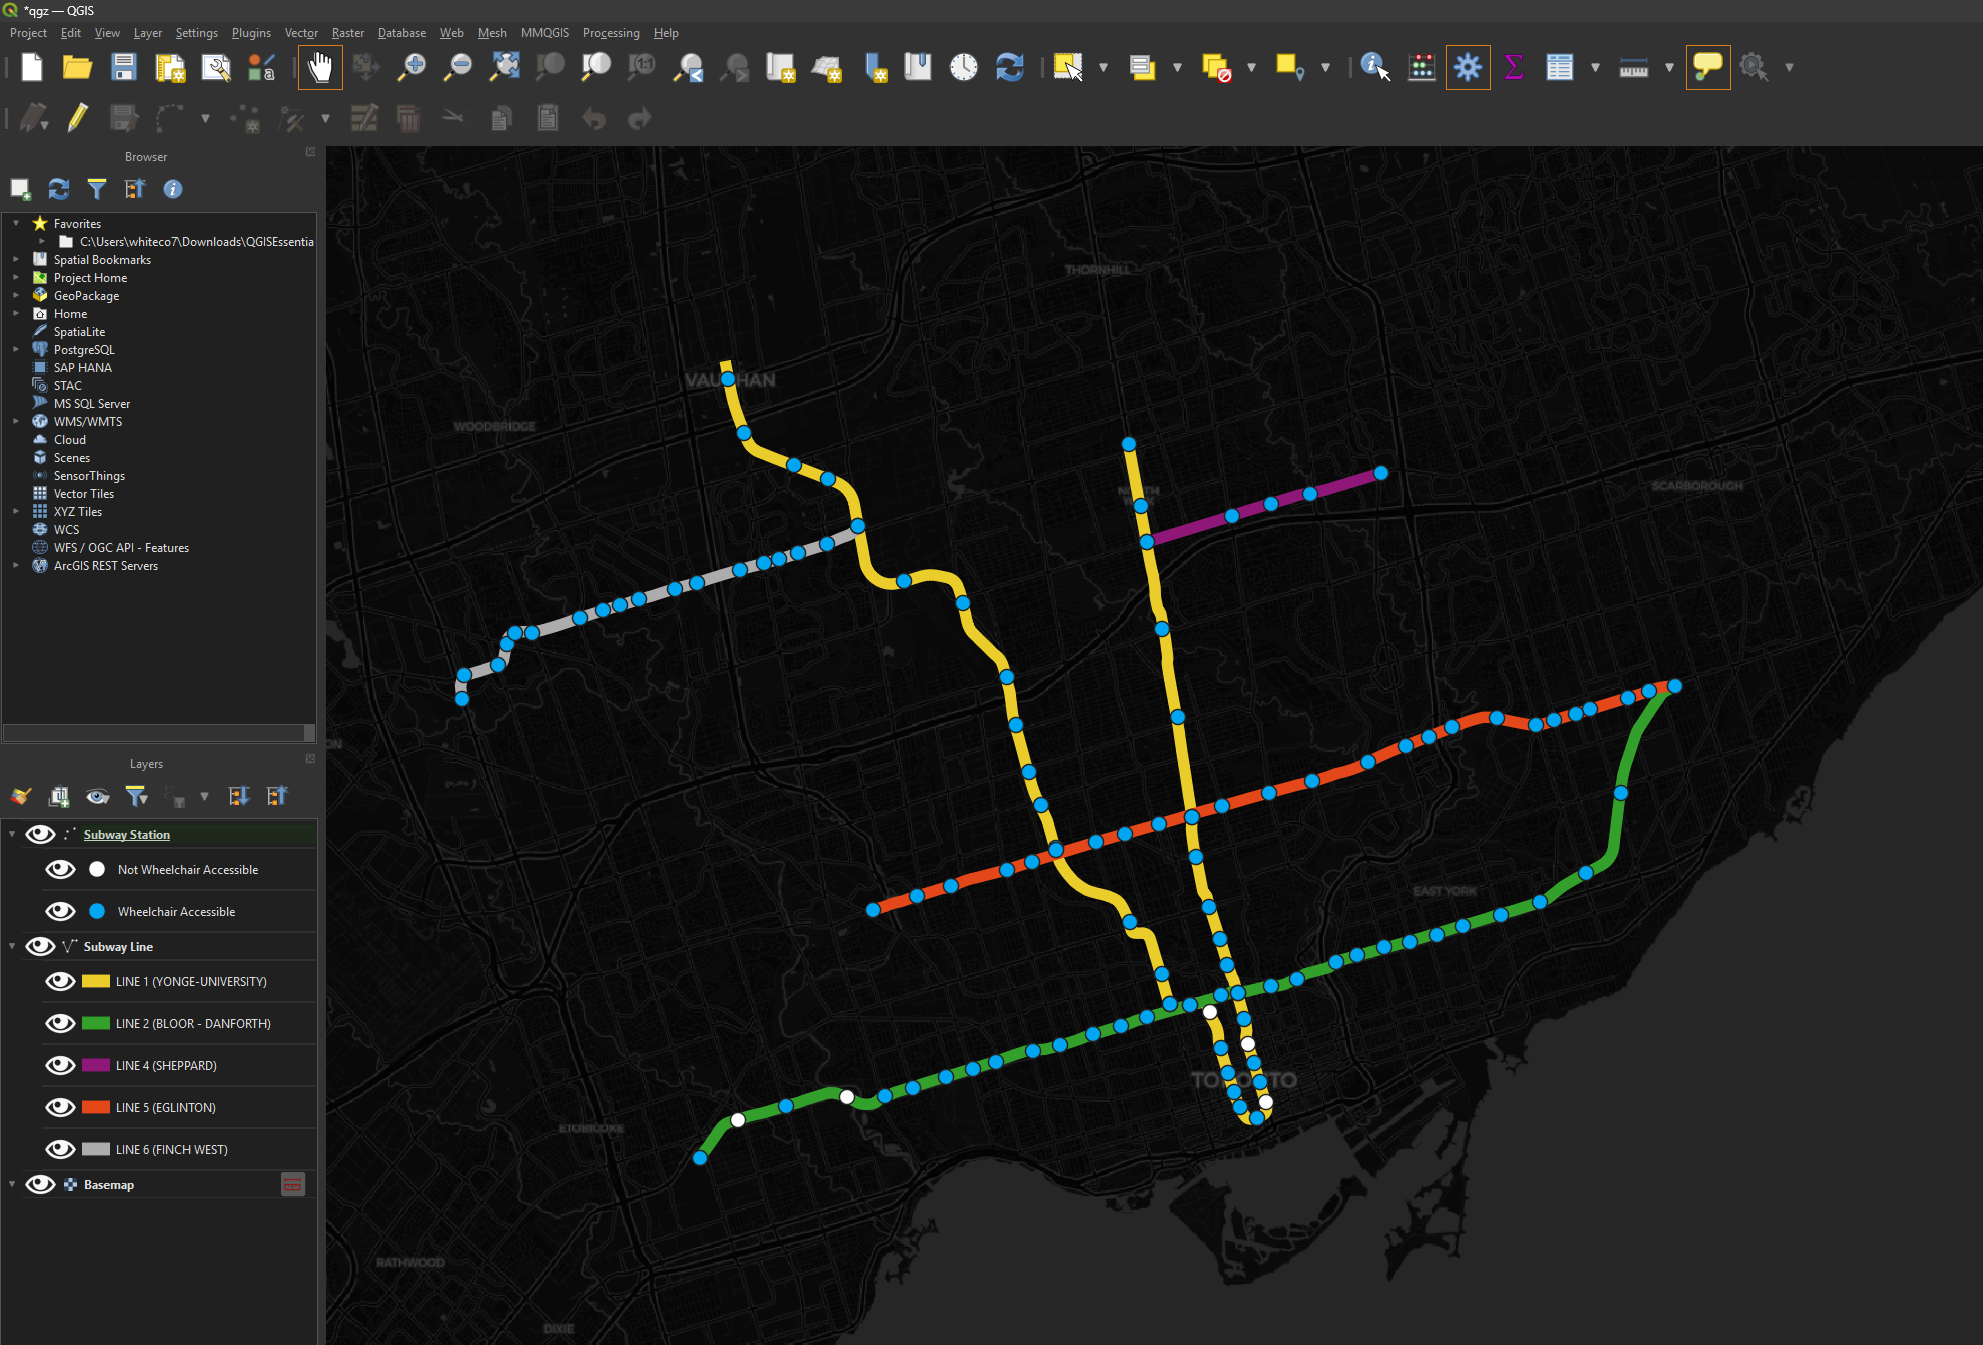
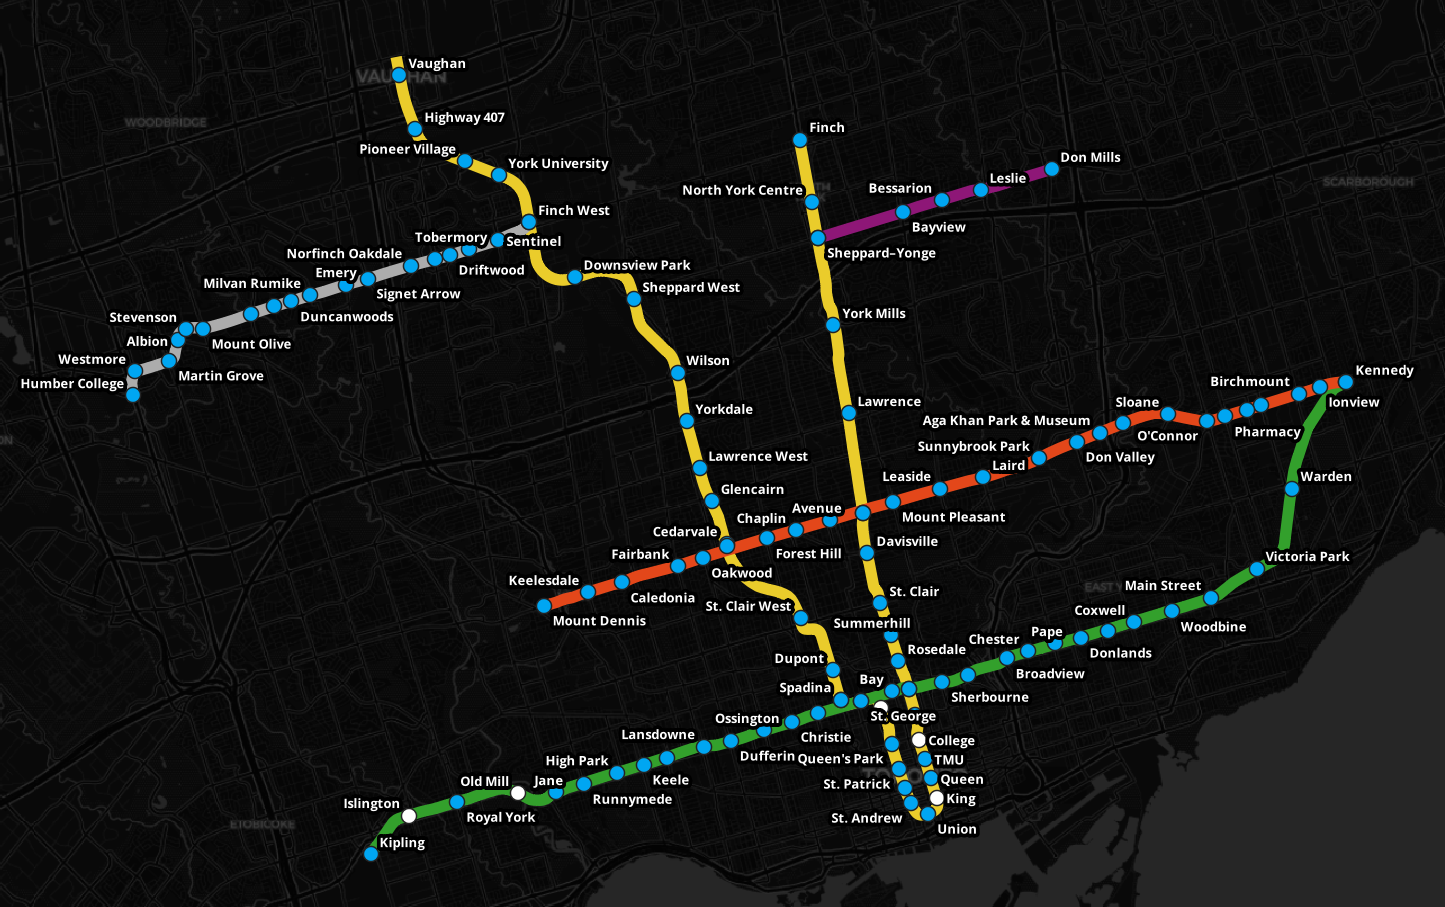
- Enable and configure any labels you’d like to appear on your map. Here, subway stations are labeled with their names. See the labeling section of MDL’s introductory QGIS tutorial for more information.
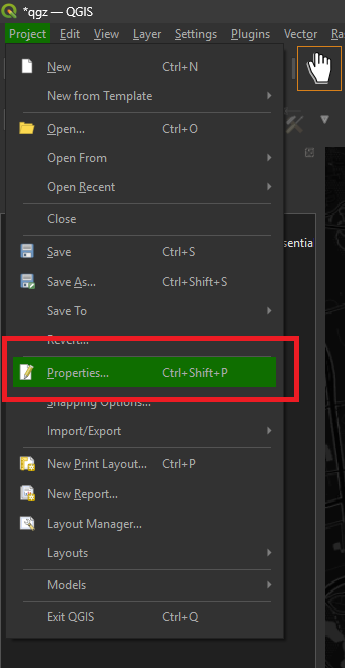
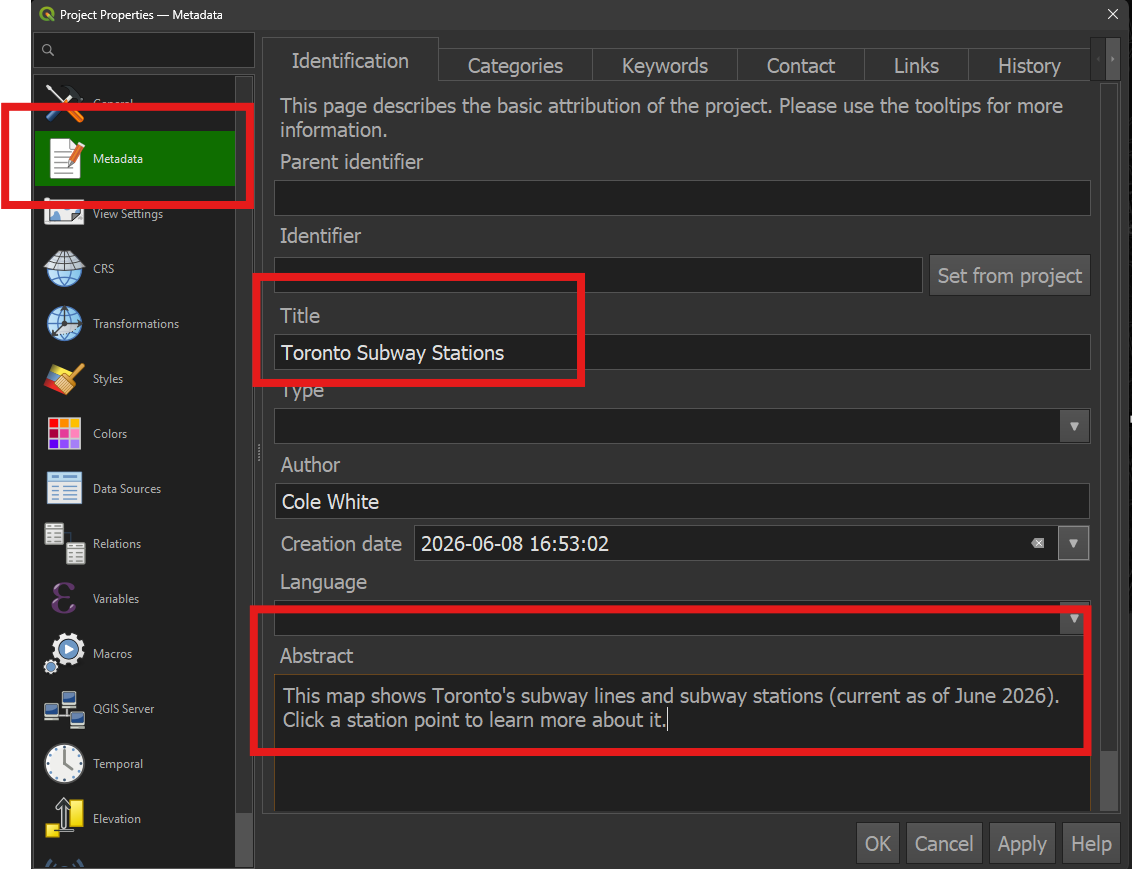
- Optionally, go to Project → Properties → Metadata and set a Title and Abstract for your map. The web map can be configured to display this information.
Create the web map
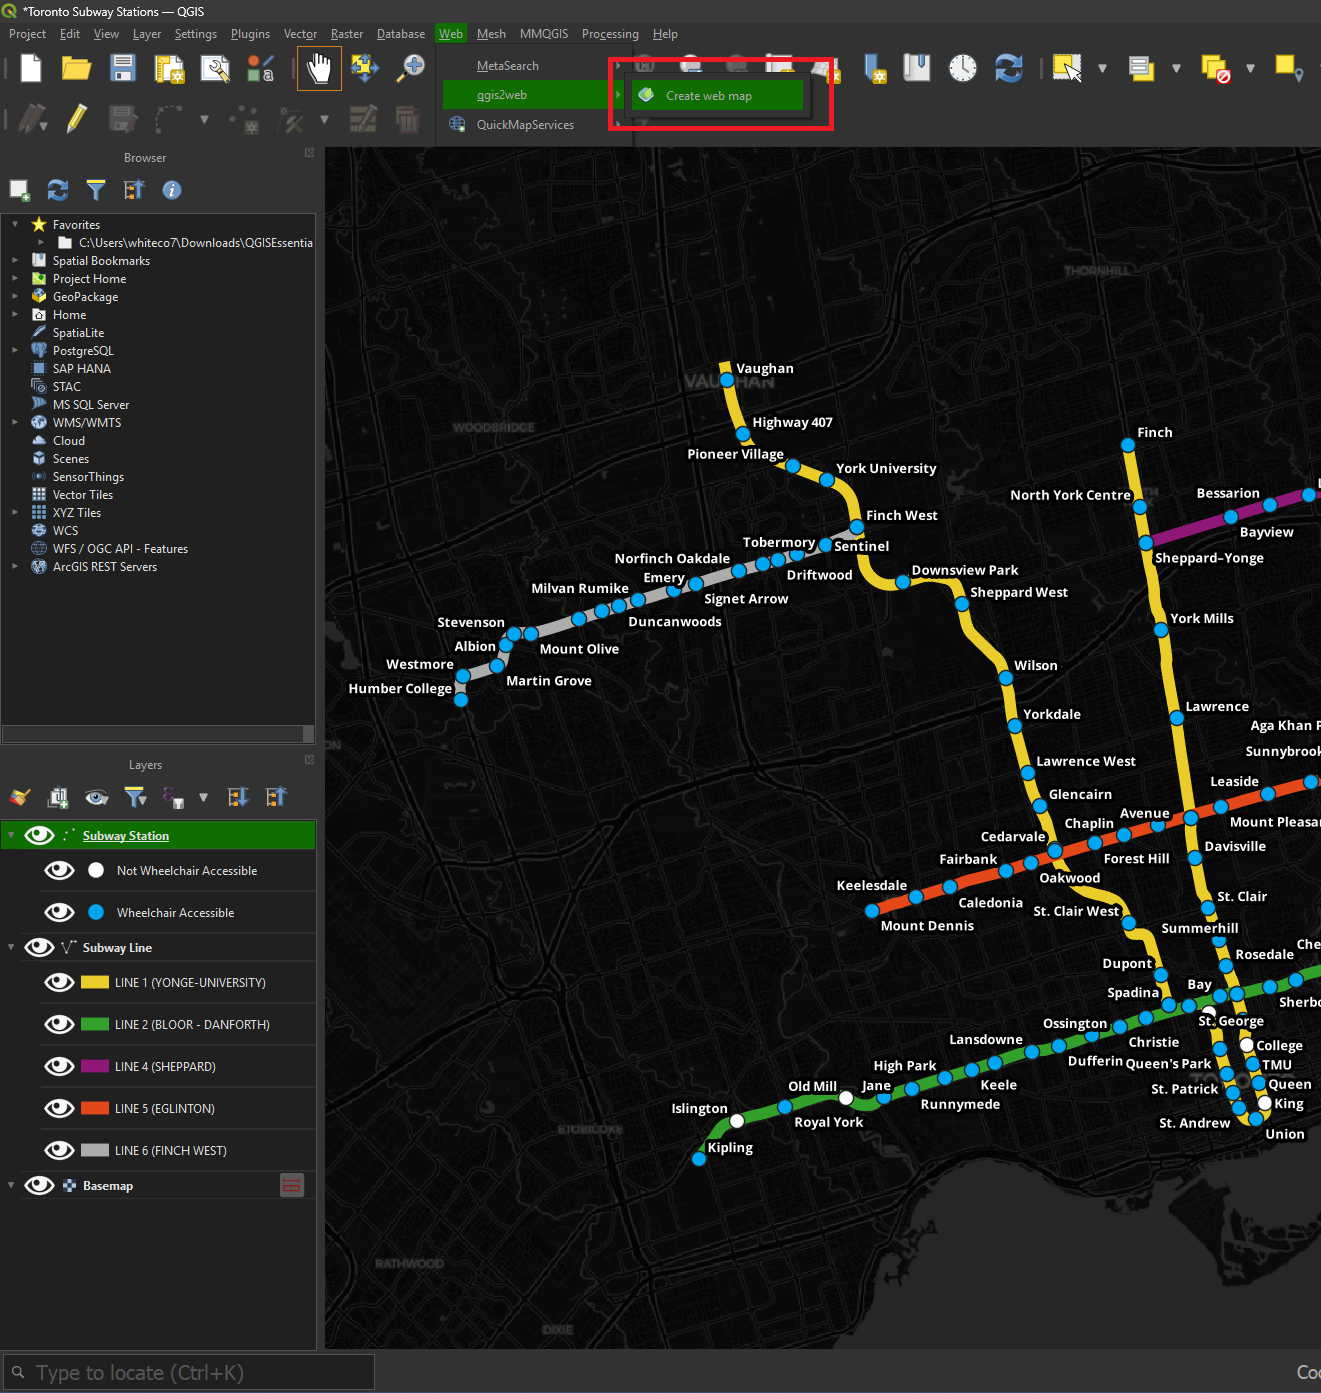
- Go to Web → qgis2web → Create web map.
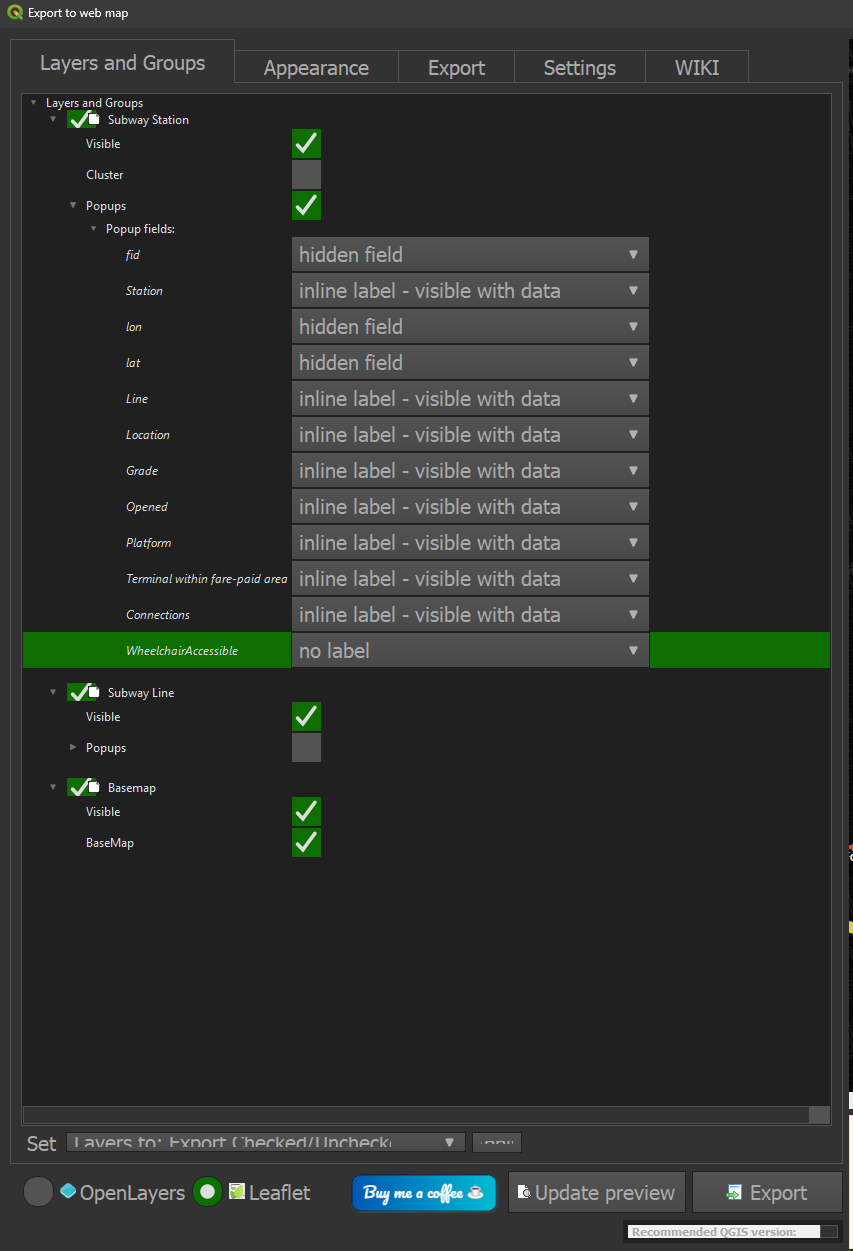
- On the Layers and Groups tab, configure the visibility and popup settings for each layer in your map. In this example, informational fields from the Subway Station layer will be displayed within a popup when the user clicks a feature. There are no popups associated with the Subway Line layer - the layer will be displayed, but it won’t respond to any click events from the user.
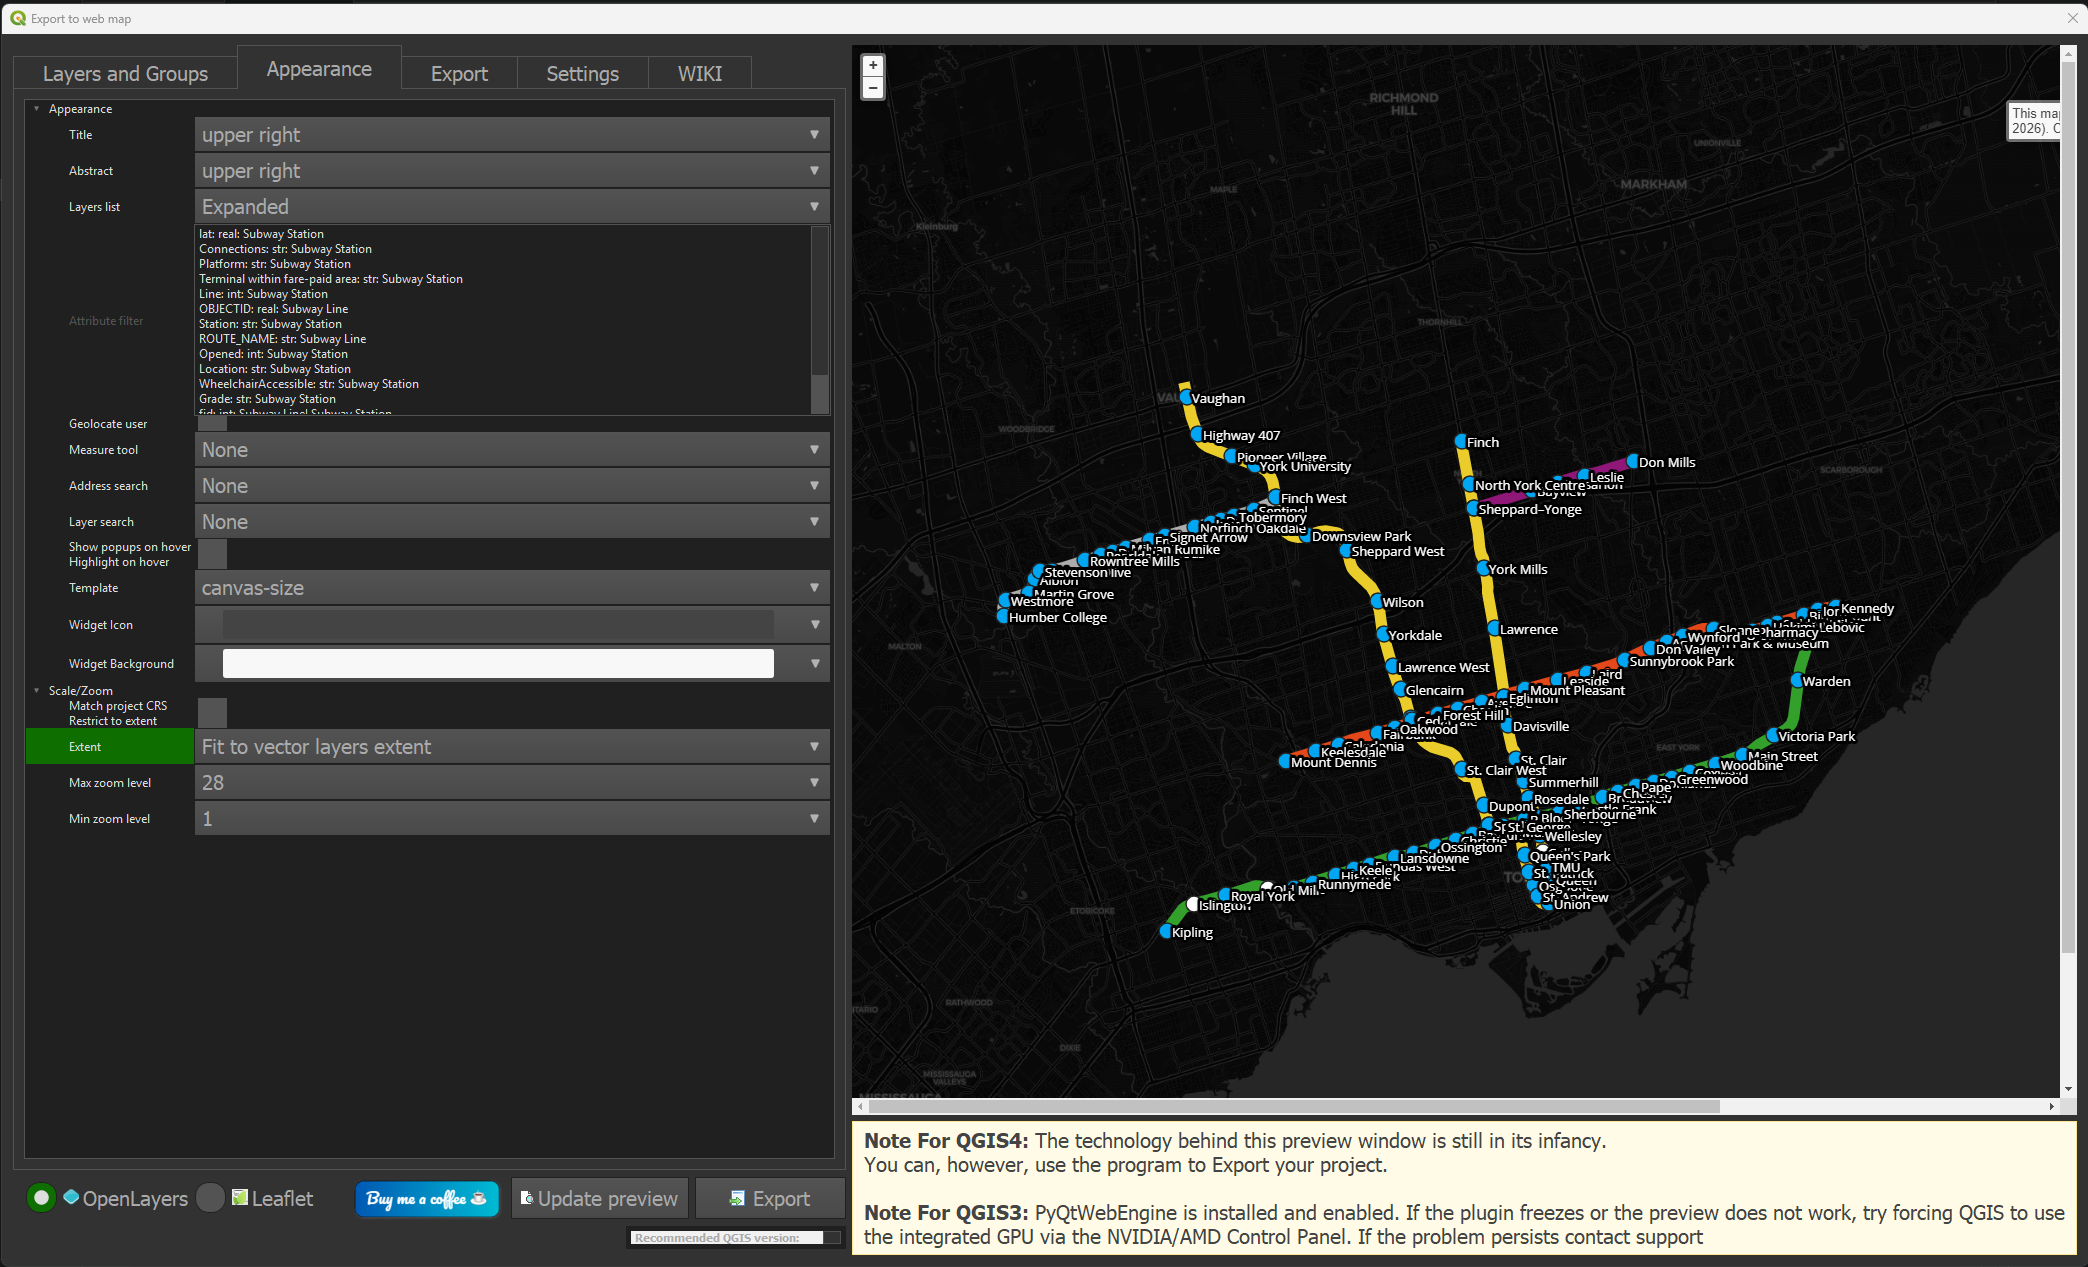
- Click the Appearance tab. From here, you can configure a variety of display options. In this example, the project’s title and abstract will be displayed in the upper-right corner of the web map. A layers list will be visible. The map will be displayed as a smaller canvas rather than a full-screen display. The extent option has been set to ‘Fit to vector layers extent’ in order to zoom your viewers in to the area of interest.
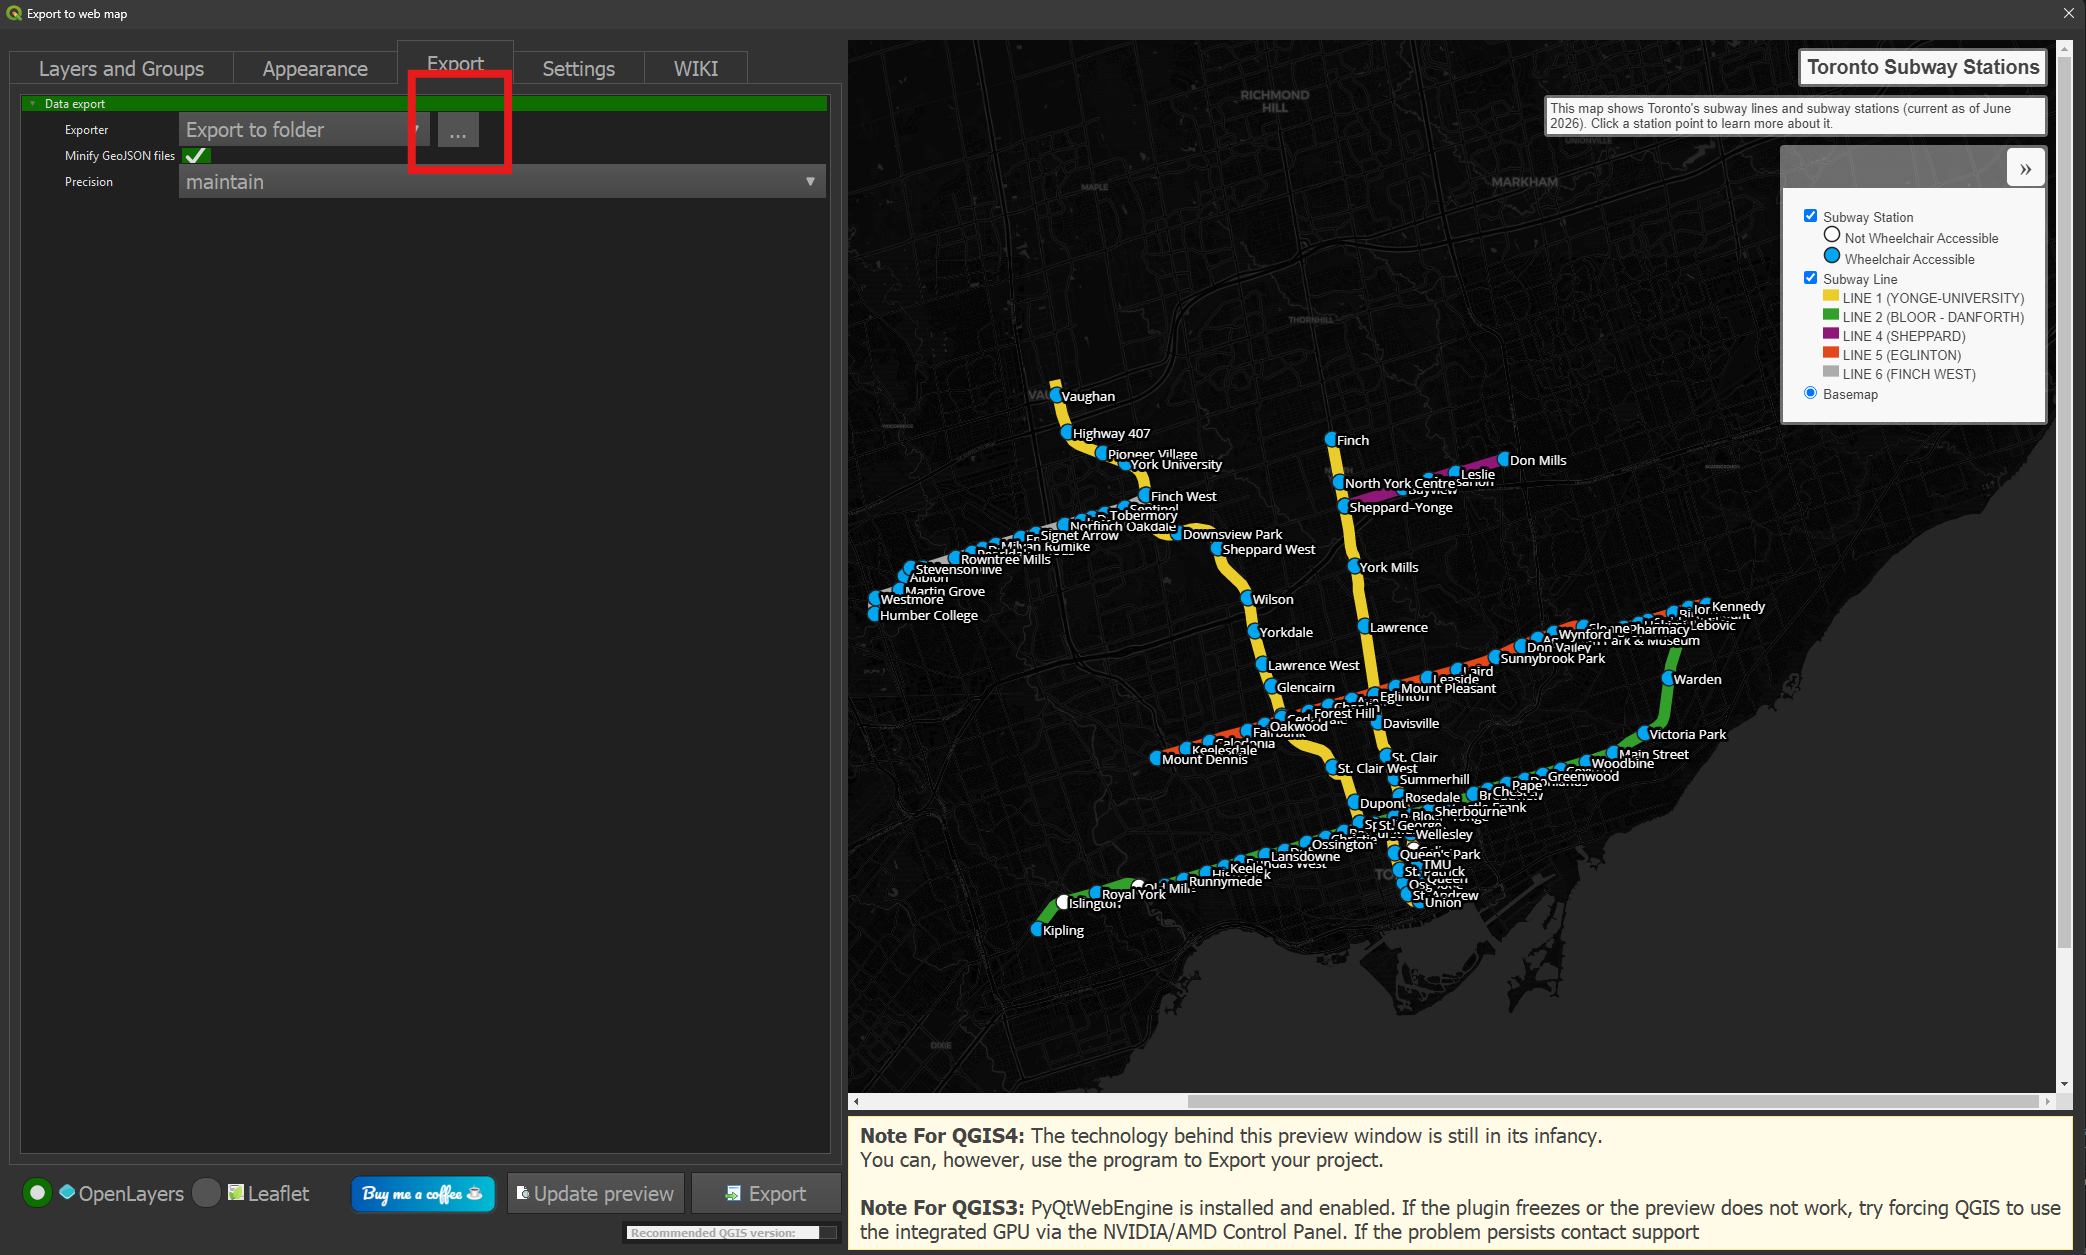
- On the Export tab, specify a folder on your computer where the output files will be saved.
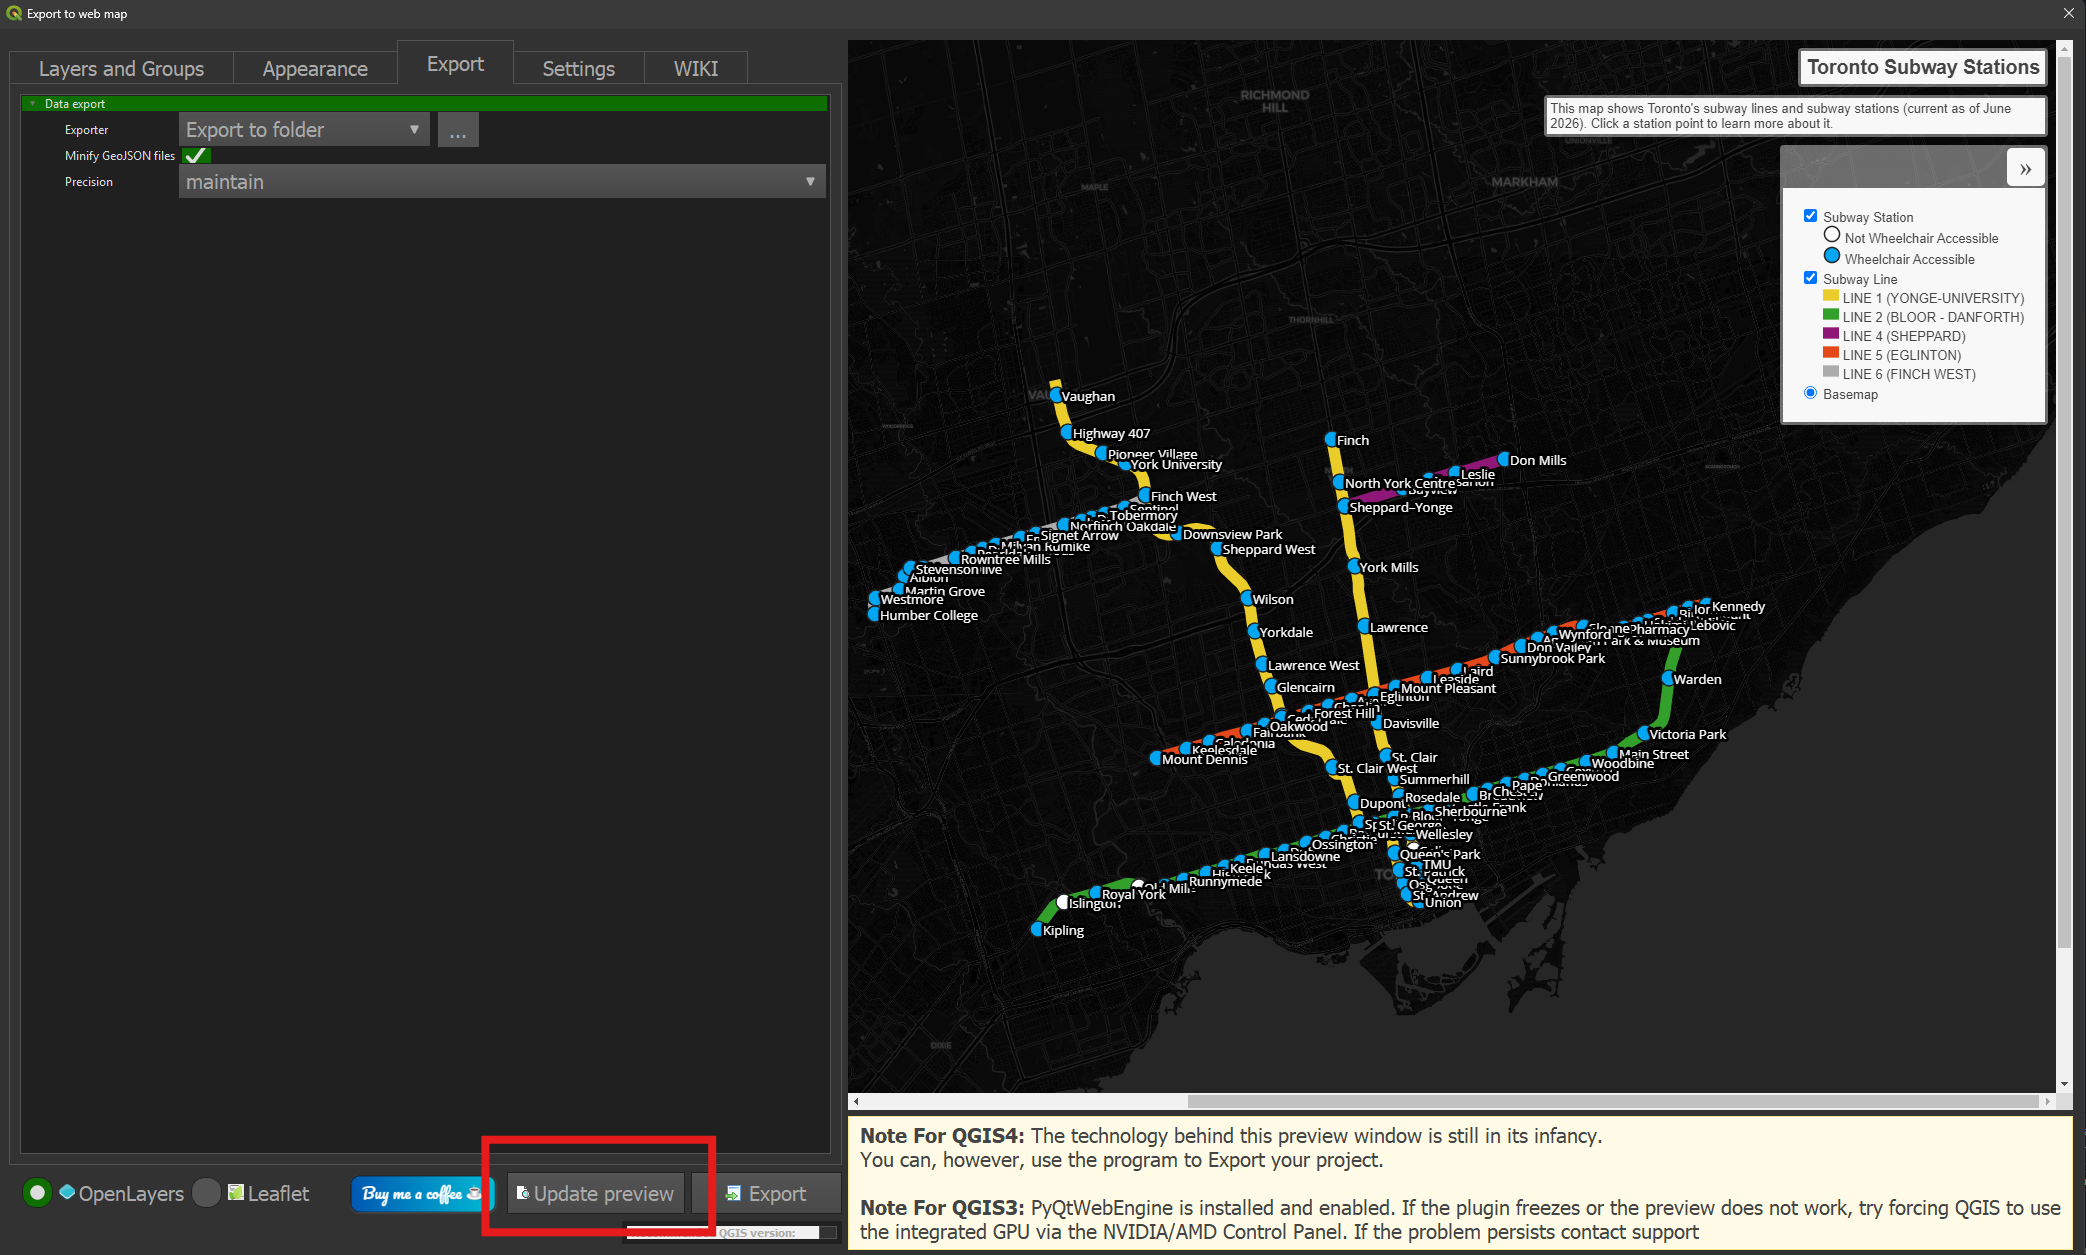
- Click the Update preview button to see what your web map will look like once deployed. (Note: at the time of writing this tutorial using QGIS 3.44 in Windows, the preview was initially not displaying properly. This issue was resolved by reinstalling PtQtWebEngine using the OSGeo4W installer.)
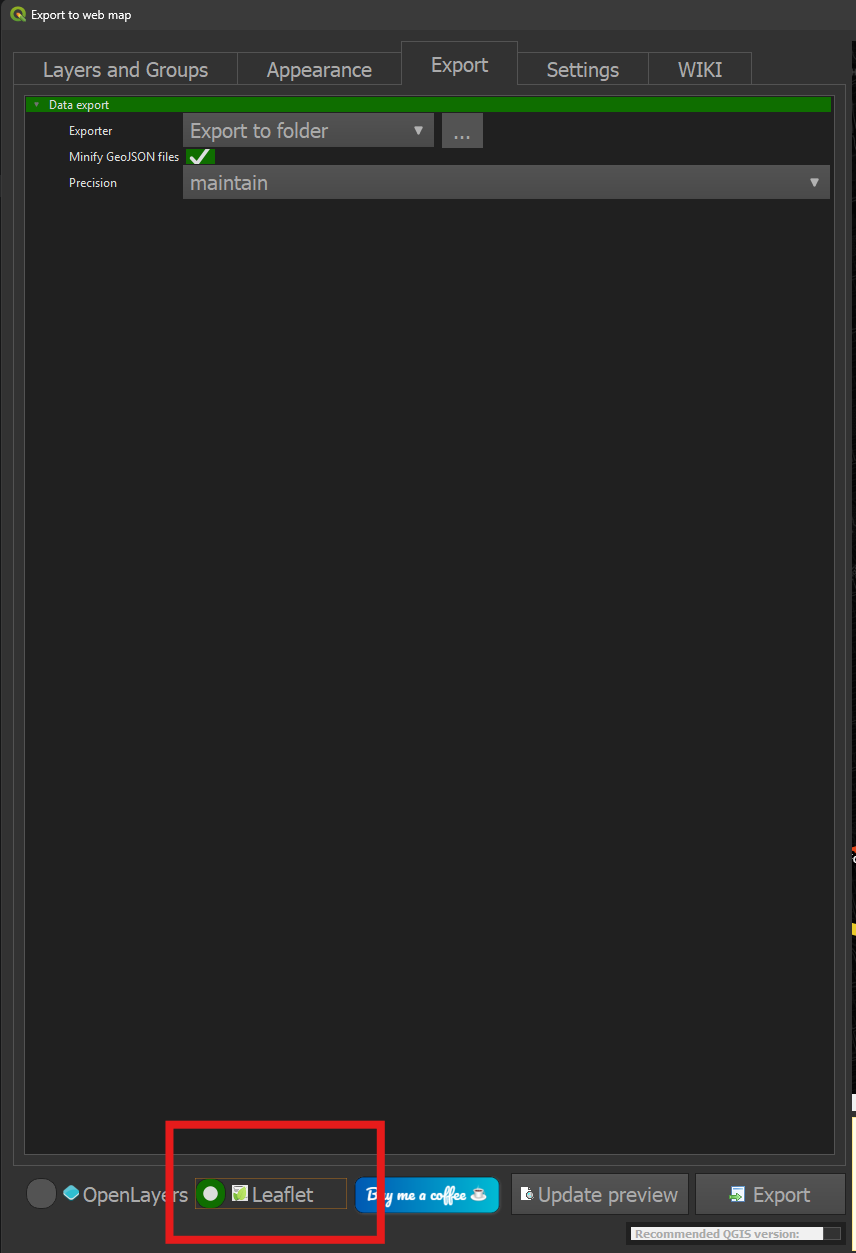
- Choose whether you’d like the output to use Leaflet or OpenLayers. Leaflet is used in this example as a more beginner-friendly option.
When the settings are configured to your liking, click Export.
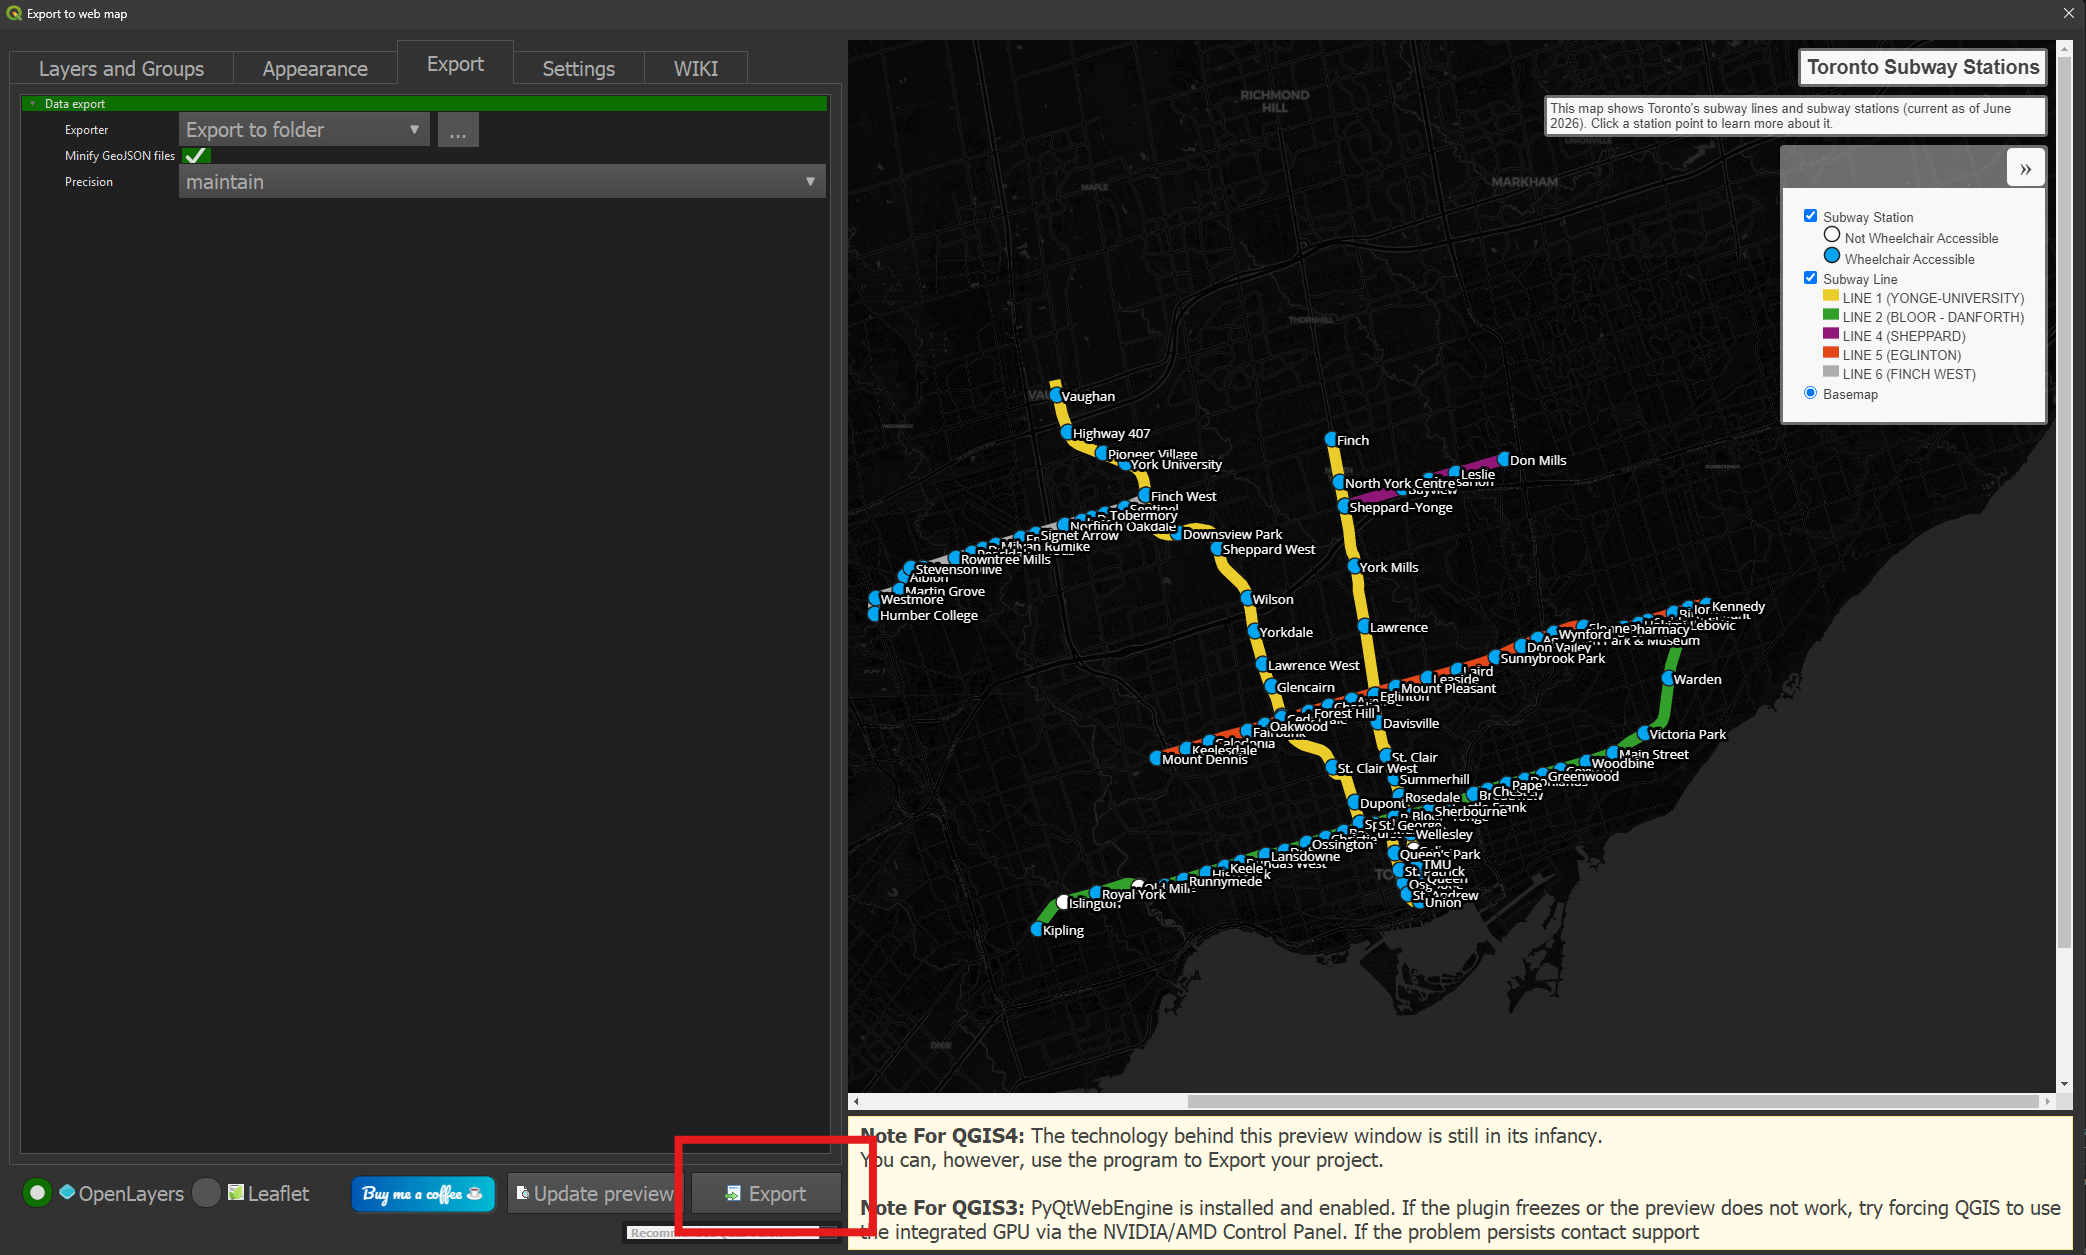
The HTML, CSS, and JavaScript files needed to create the web map will be saved to your computer. The project will automatically be opened in a web browser.
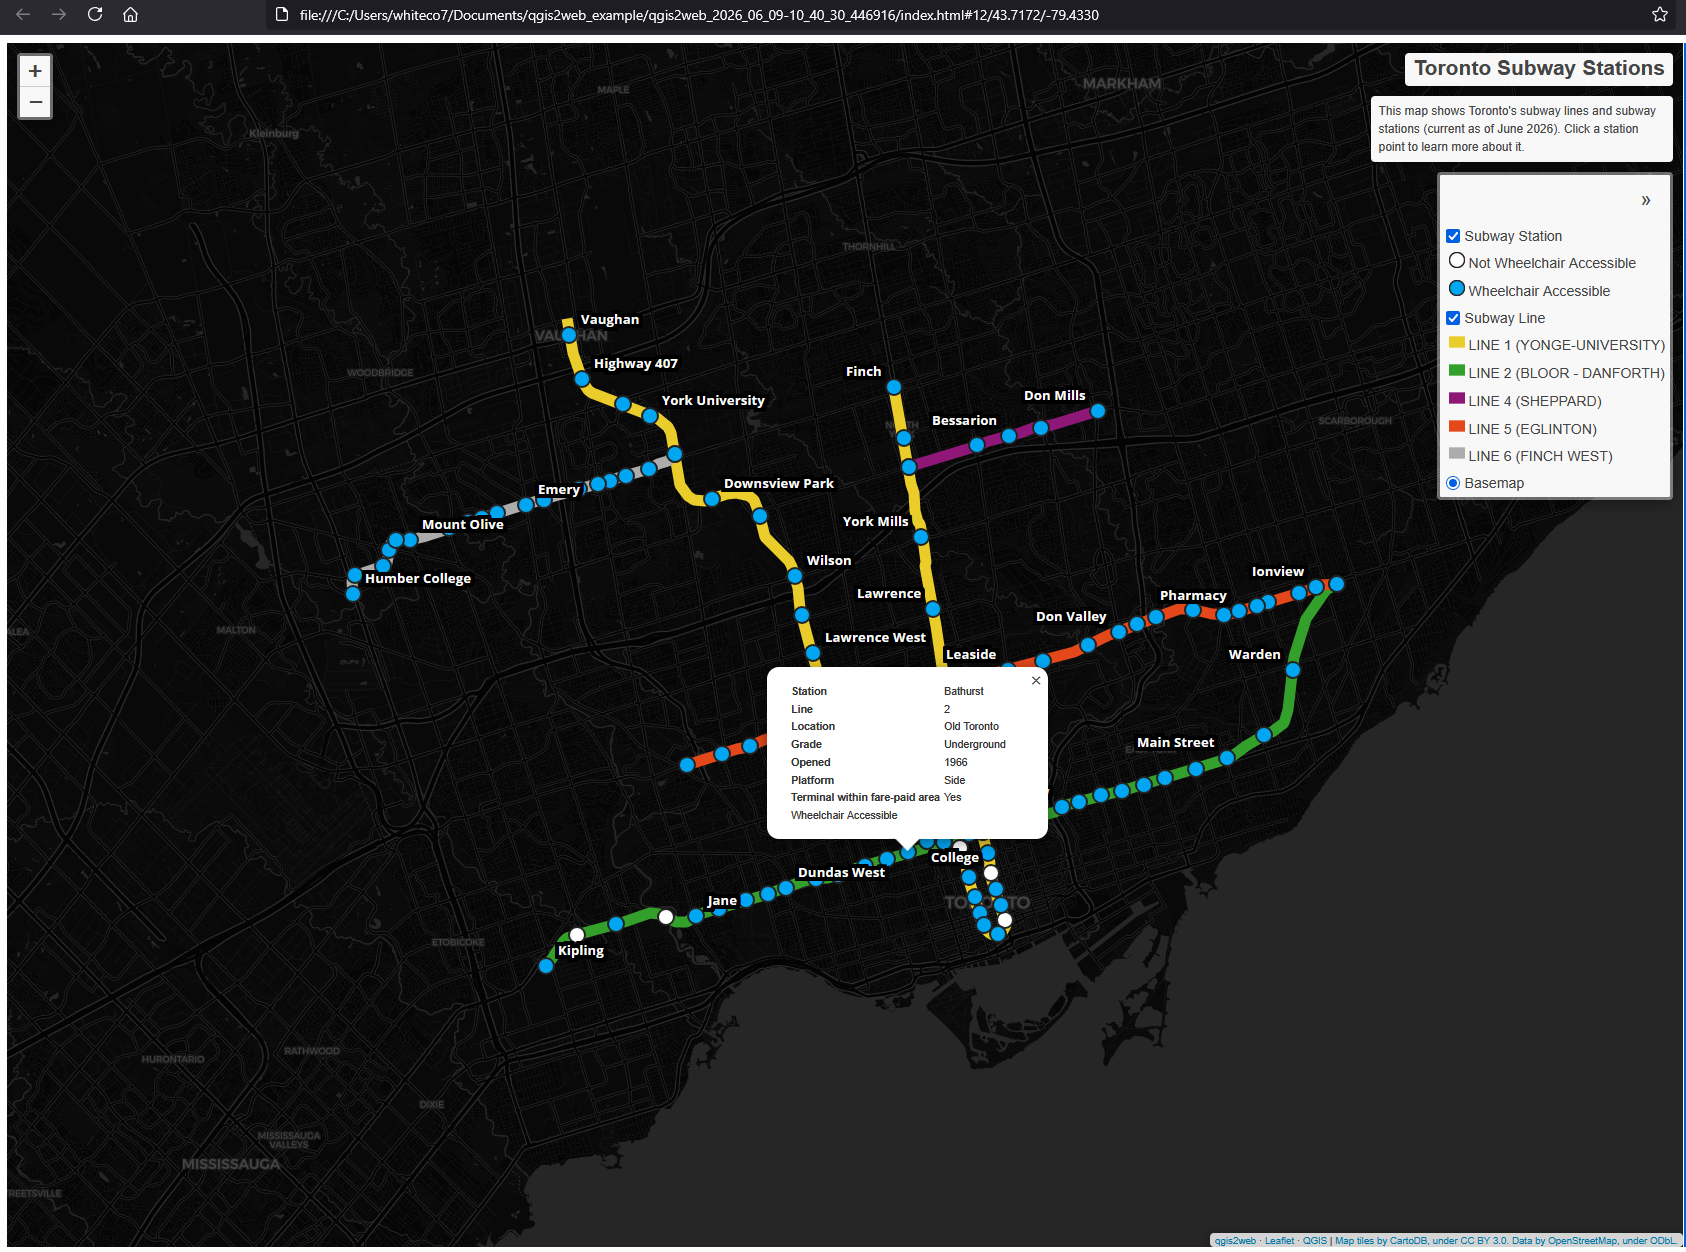
Optional: Further HTML, CSS, and JavaScript customization
- If you’d like to customize your web map further, you can edit and tweak the output HTML, CSS, and JavaScript files. As an example, here is the index.html file opened in Microsoft’s Visual Studio Code editor. (Notepad or any other text editor would also work fine for this.)
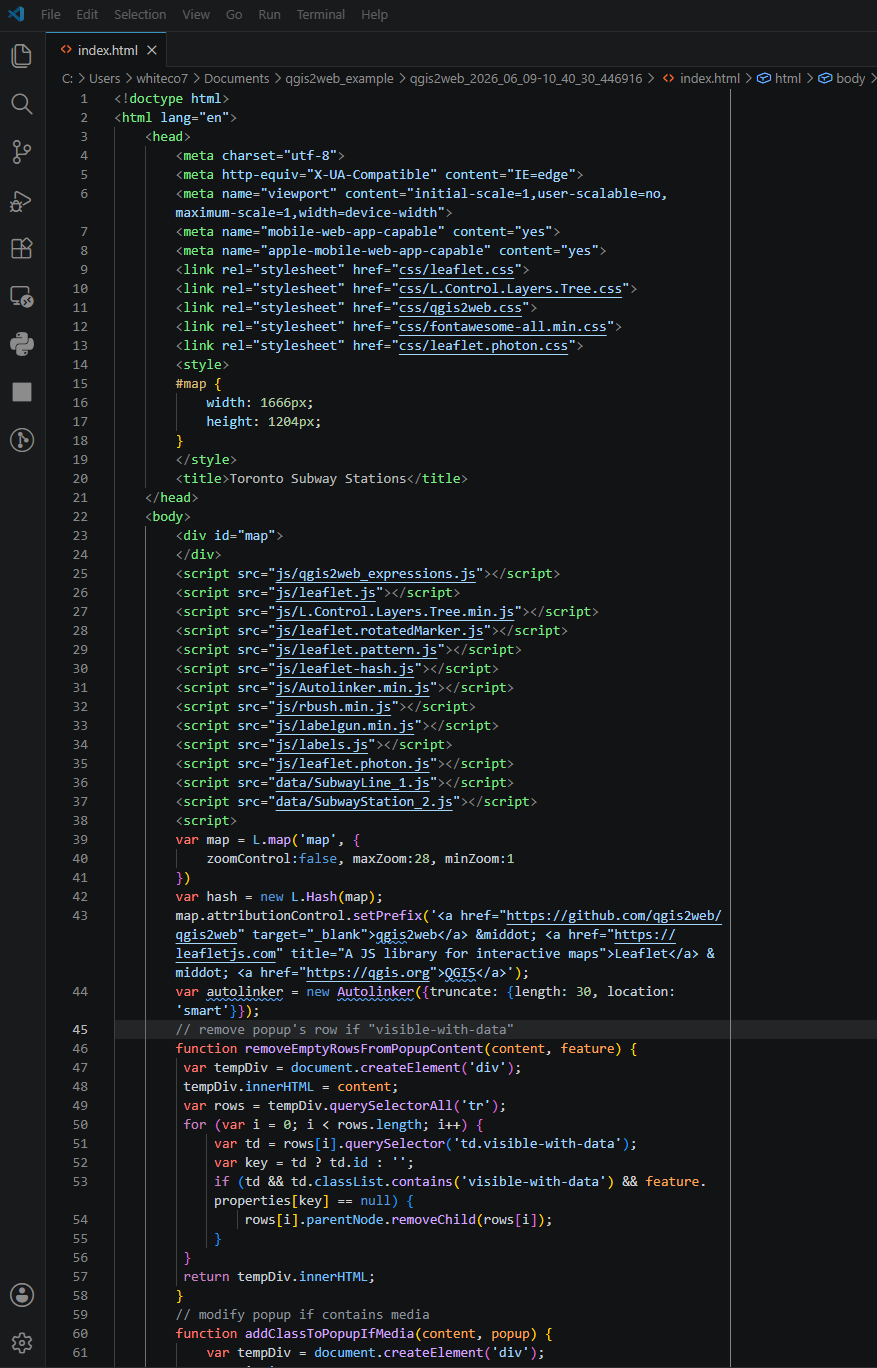
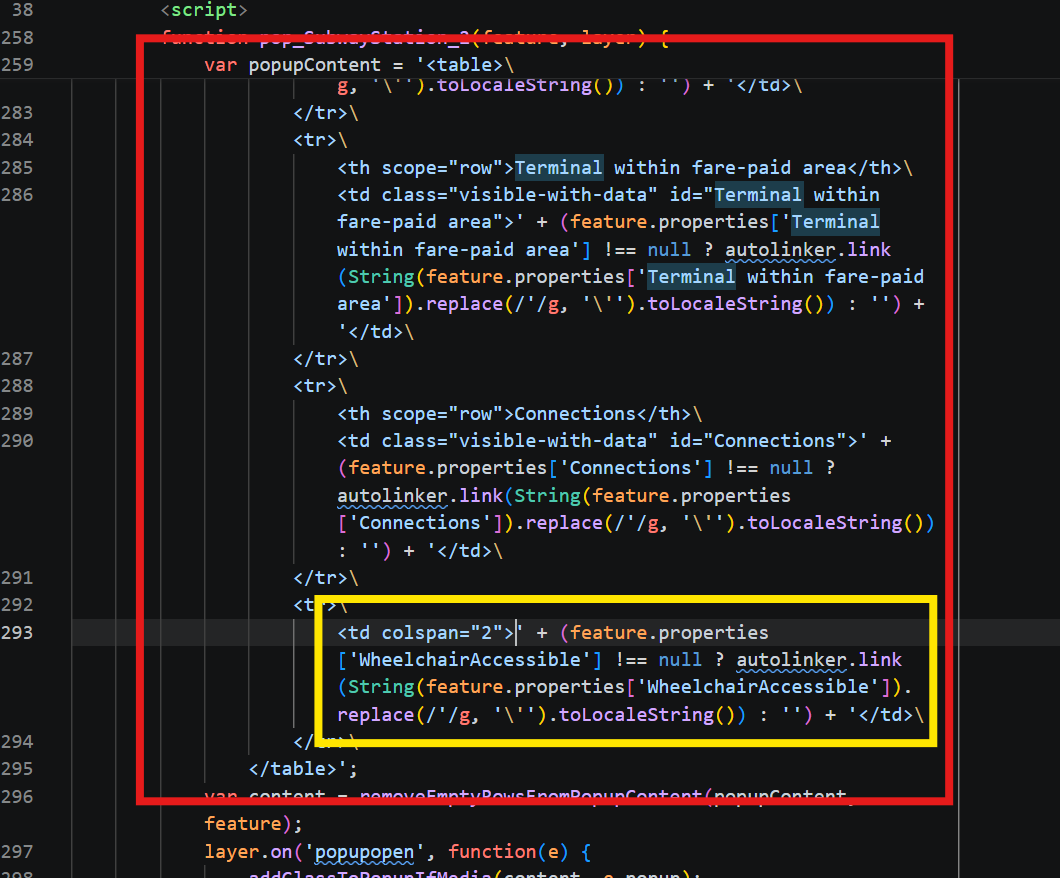
In this example, let’s say we’d like the ‘Wheelchair Accessible’ or ‘Not Wheelchair Accessible’ text in the popup to be centered within the popup and written in bold italic. This change can be made by making a very minor edit to the HTML.
- To do this, first locate the part of index.html containing the code that customizes how the popup looks. If you have an understanding of HTML and JavaScript, this will be very easy to make sense of. But even if you’re unfamiliar with these technologies, you’ll notice that the code doesn’t look too different from natural language, and the word ‘popupContent’ on Line 259 will give you a clue that this is where the popup content is probably found.
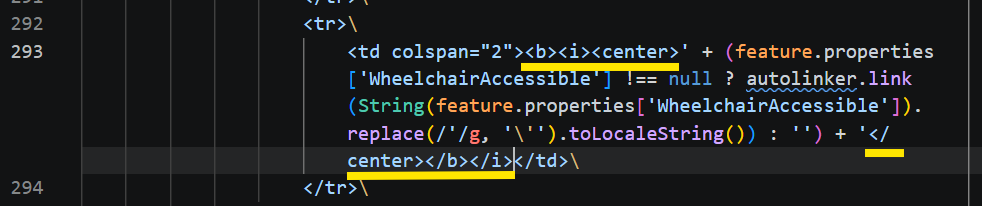
- The HTML code can be edited directly to change the way this information is displayed. Some very simple HTML tags (
<b>for bold,<i>for italic, and<center>to center the text) have been added here, on either side of the logic that displays the wheelchair accessibility info:
- Save the .html file and reload the map in your web browser to view the results:
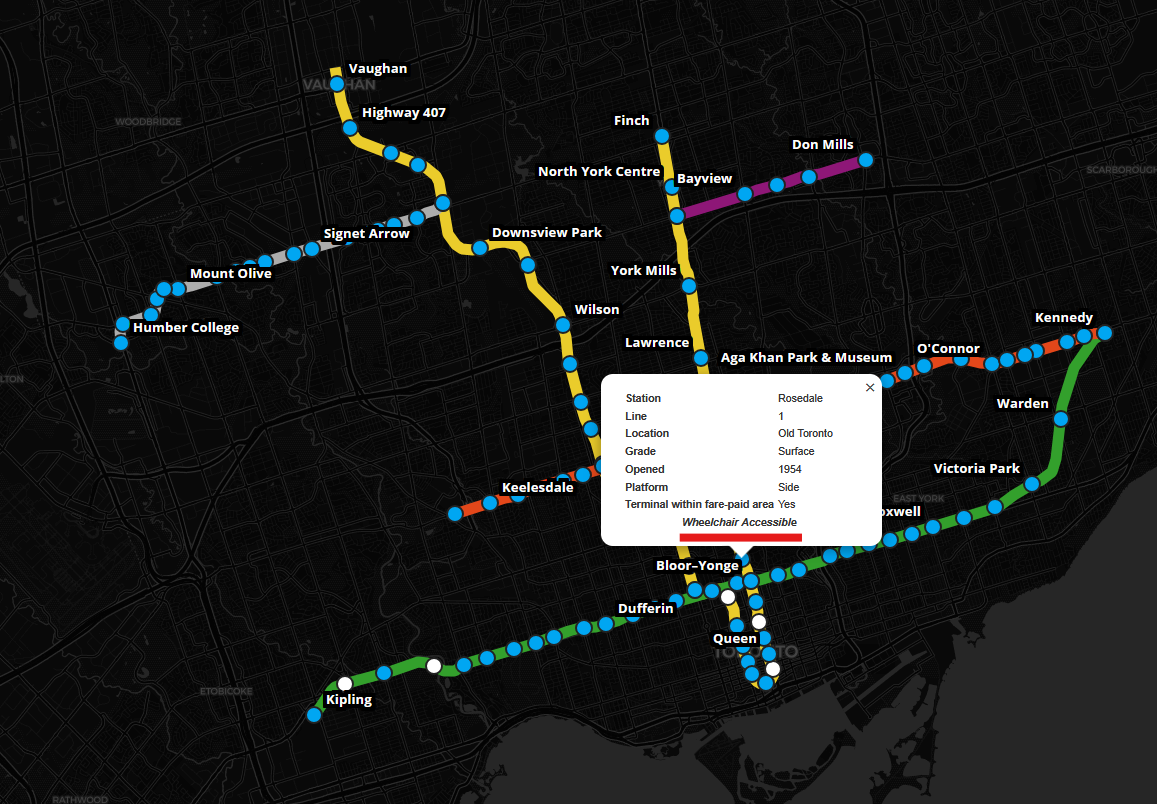
Any further customizations you’d like to make are limited only by your imagination. If you’d like to learn more about HTML, CSS, and JavaScript, see the Resources section of this tutorial.
Deploy!
Finally, the output of qgis2web can be uploaded and published as a live webpage. If you already have a website with a hosting situation allowing you to add custom code, you can incorporate what qgis2web has created there. Otherwise, follow the steps below to create and host a website using GitHub Pages.
Create a GitHub account
If you don’t already have a free GitHub account, here’s how you can create one:
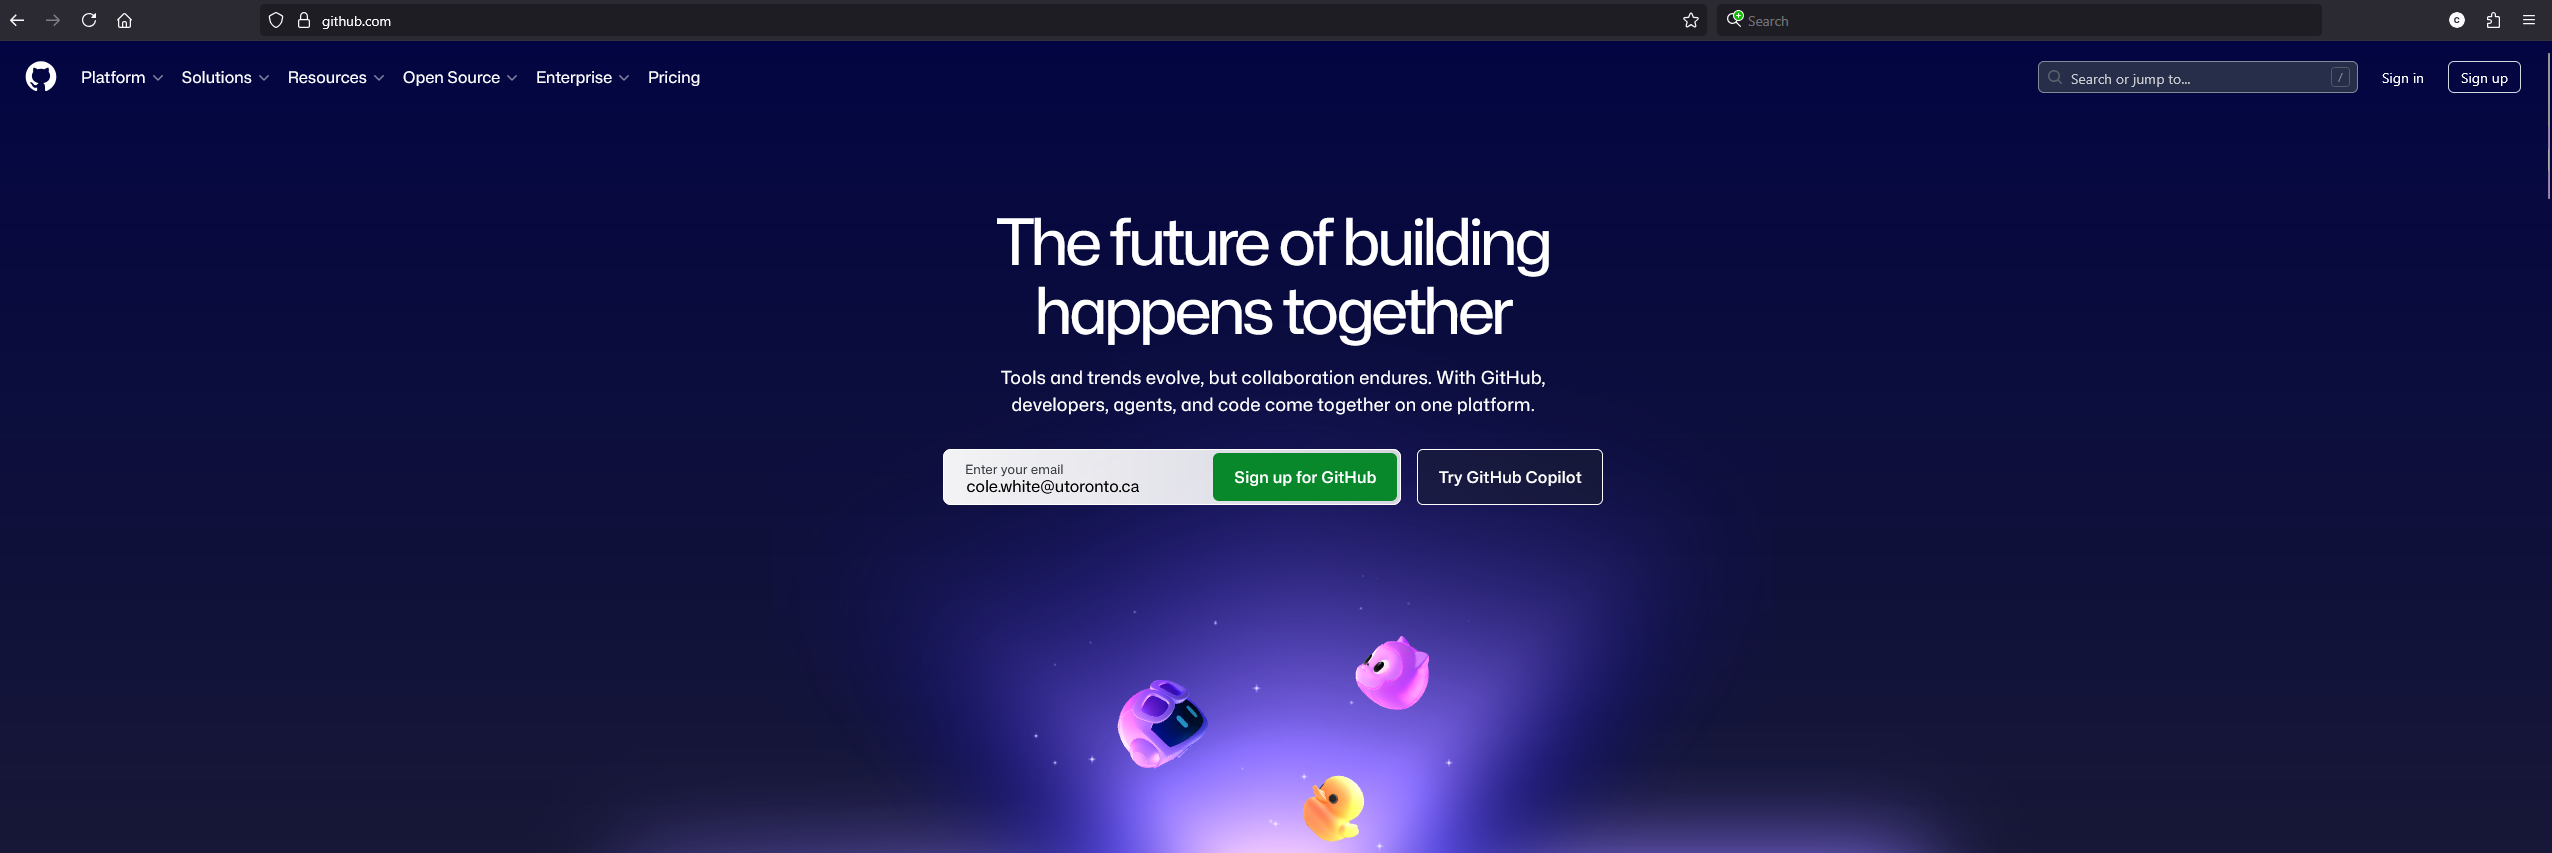
- Go to https://www.github.com/ . Enter your email and click the Sign up button.
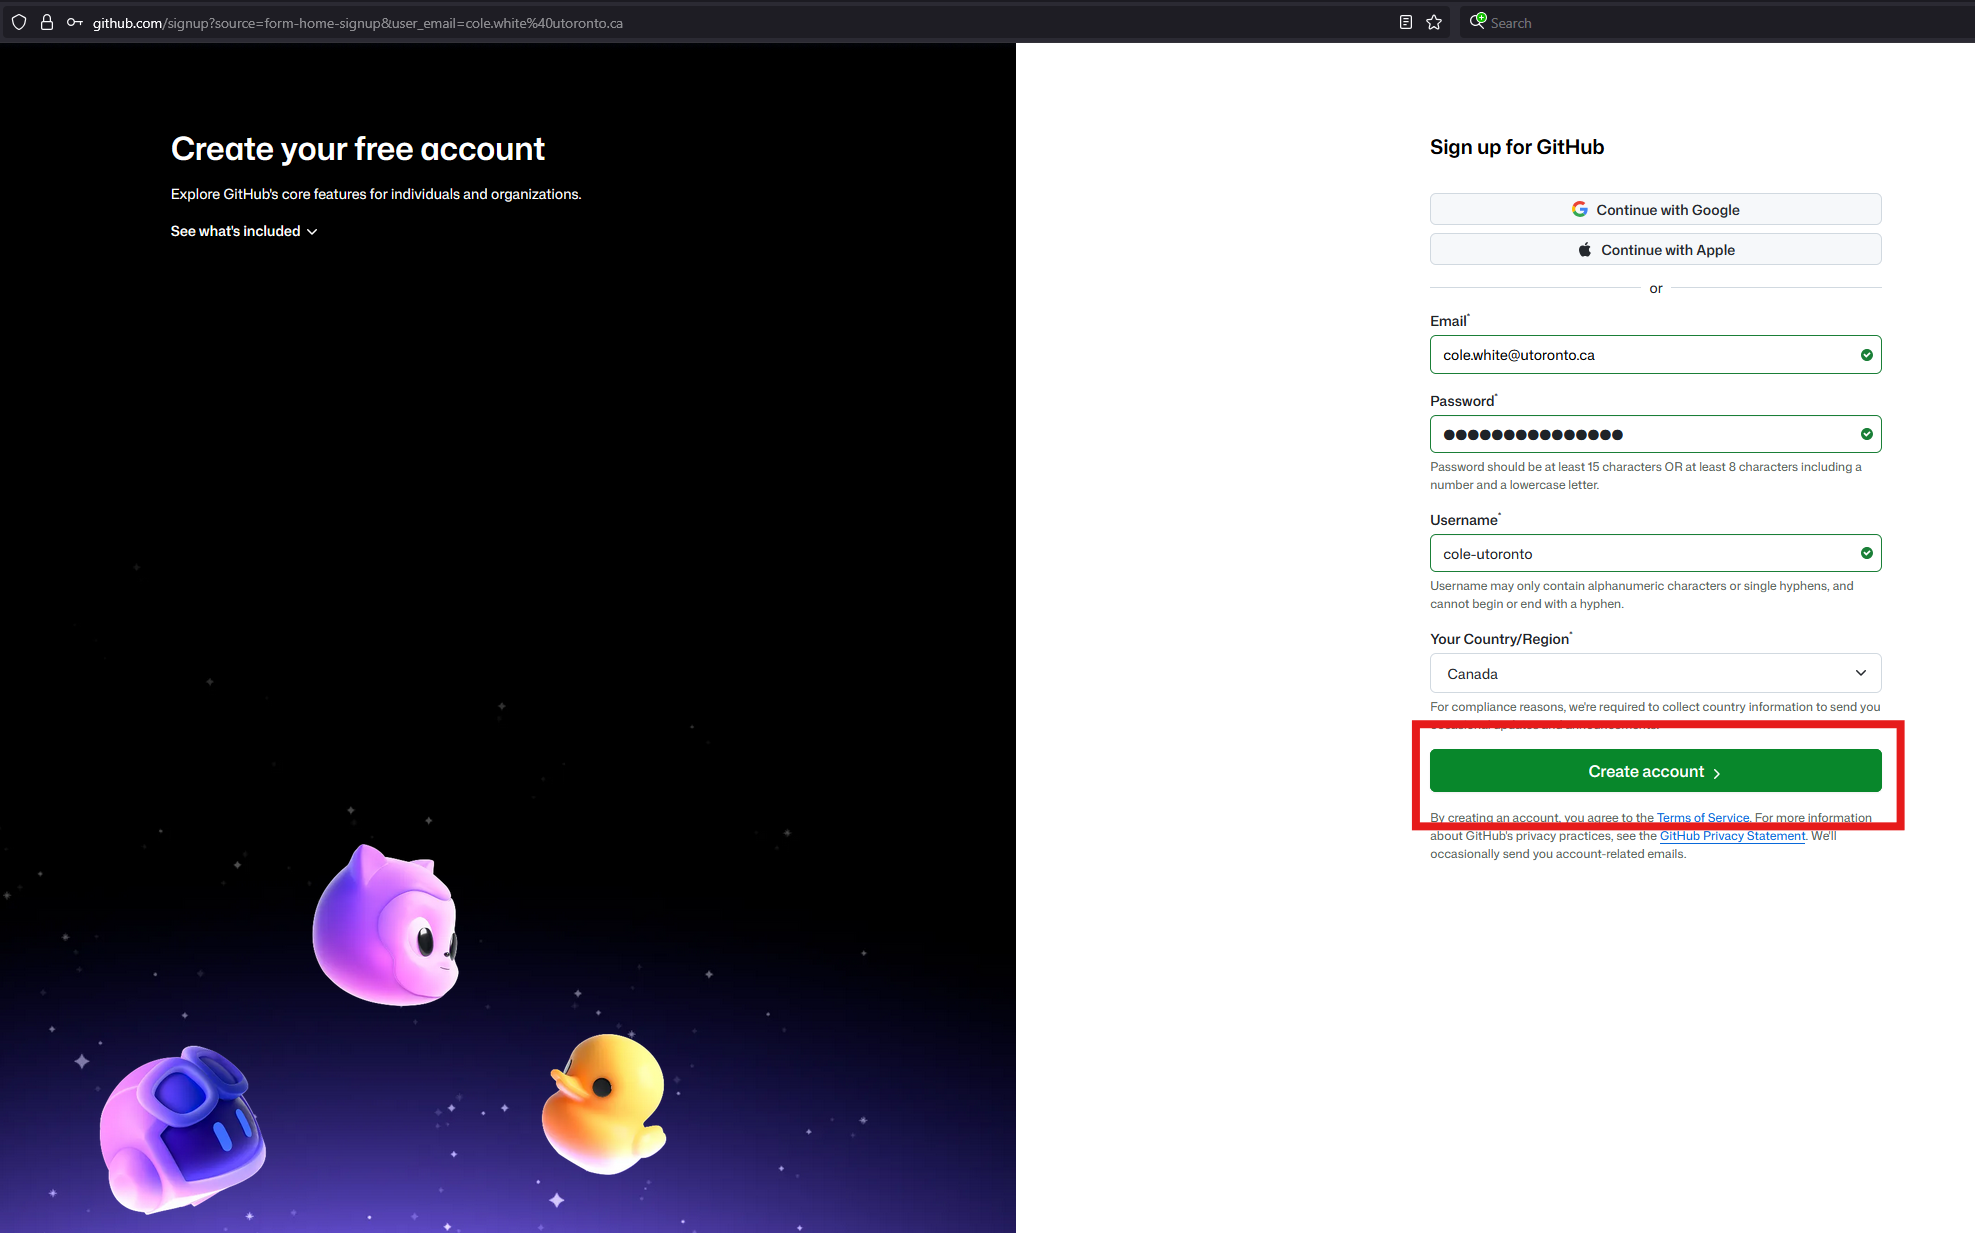
- Fill in your information and click Create Account.
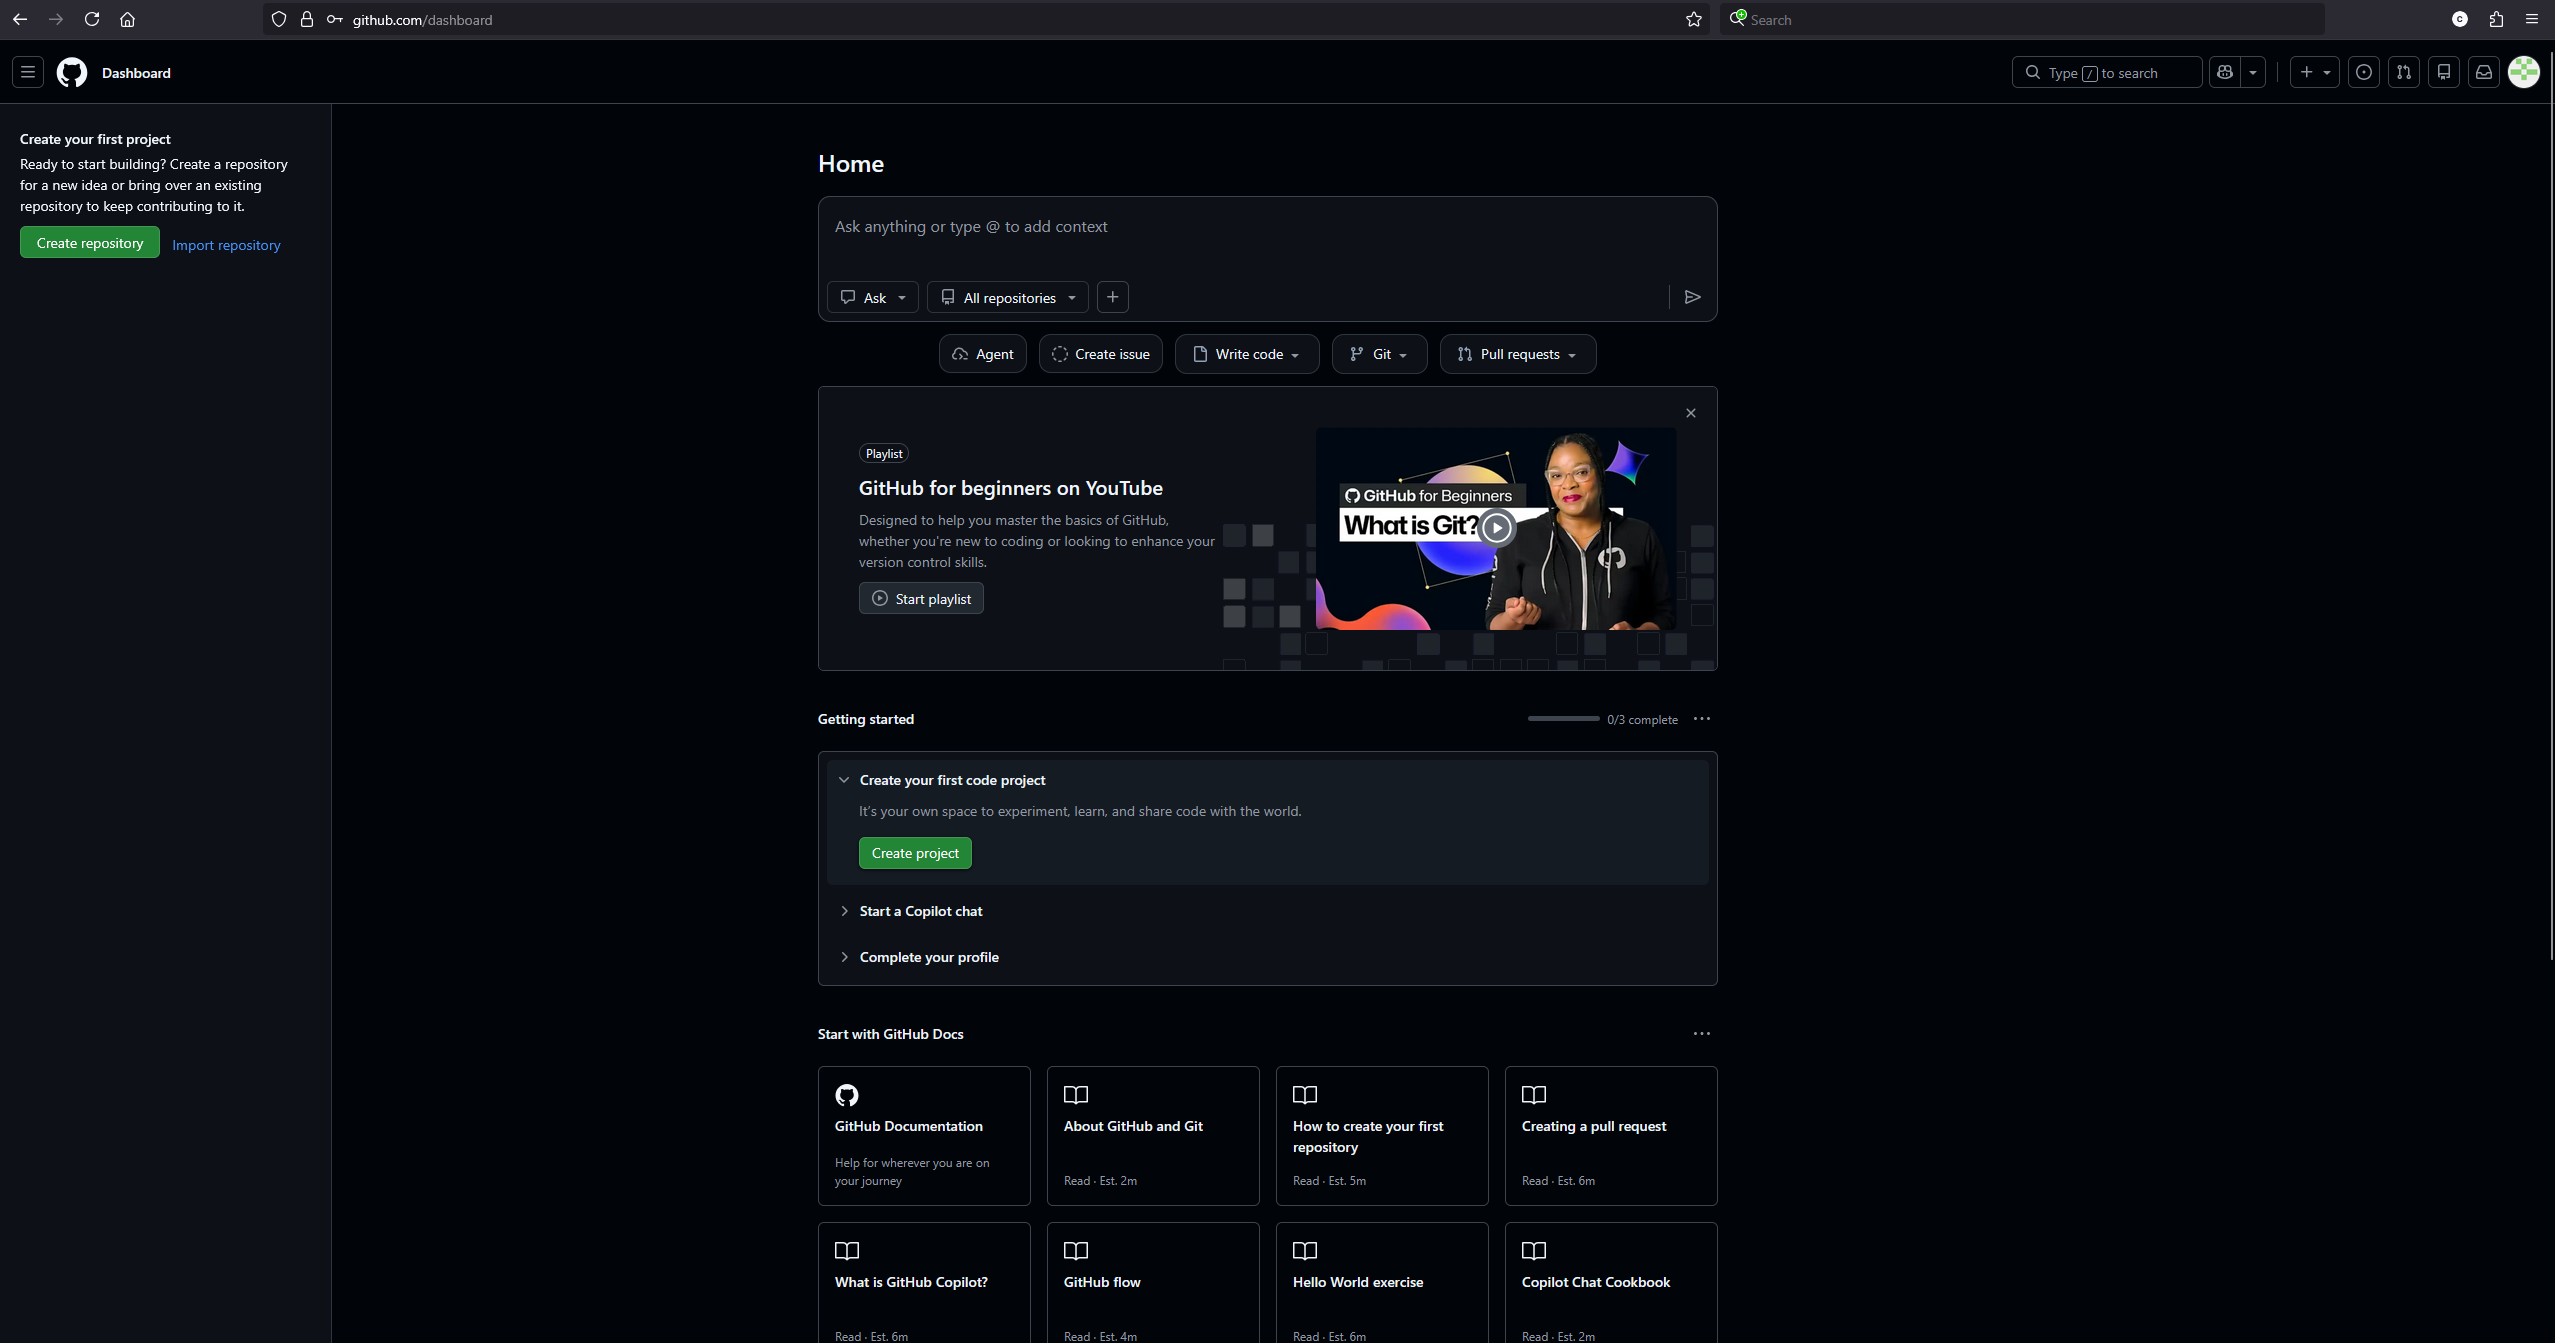
- Once you’ve verified your account and logged in, you’ll be brought to your GitHub account home page.
Create a repository for your project
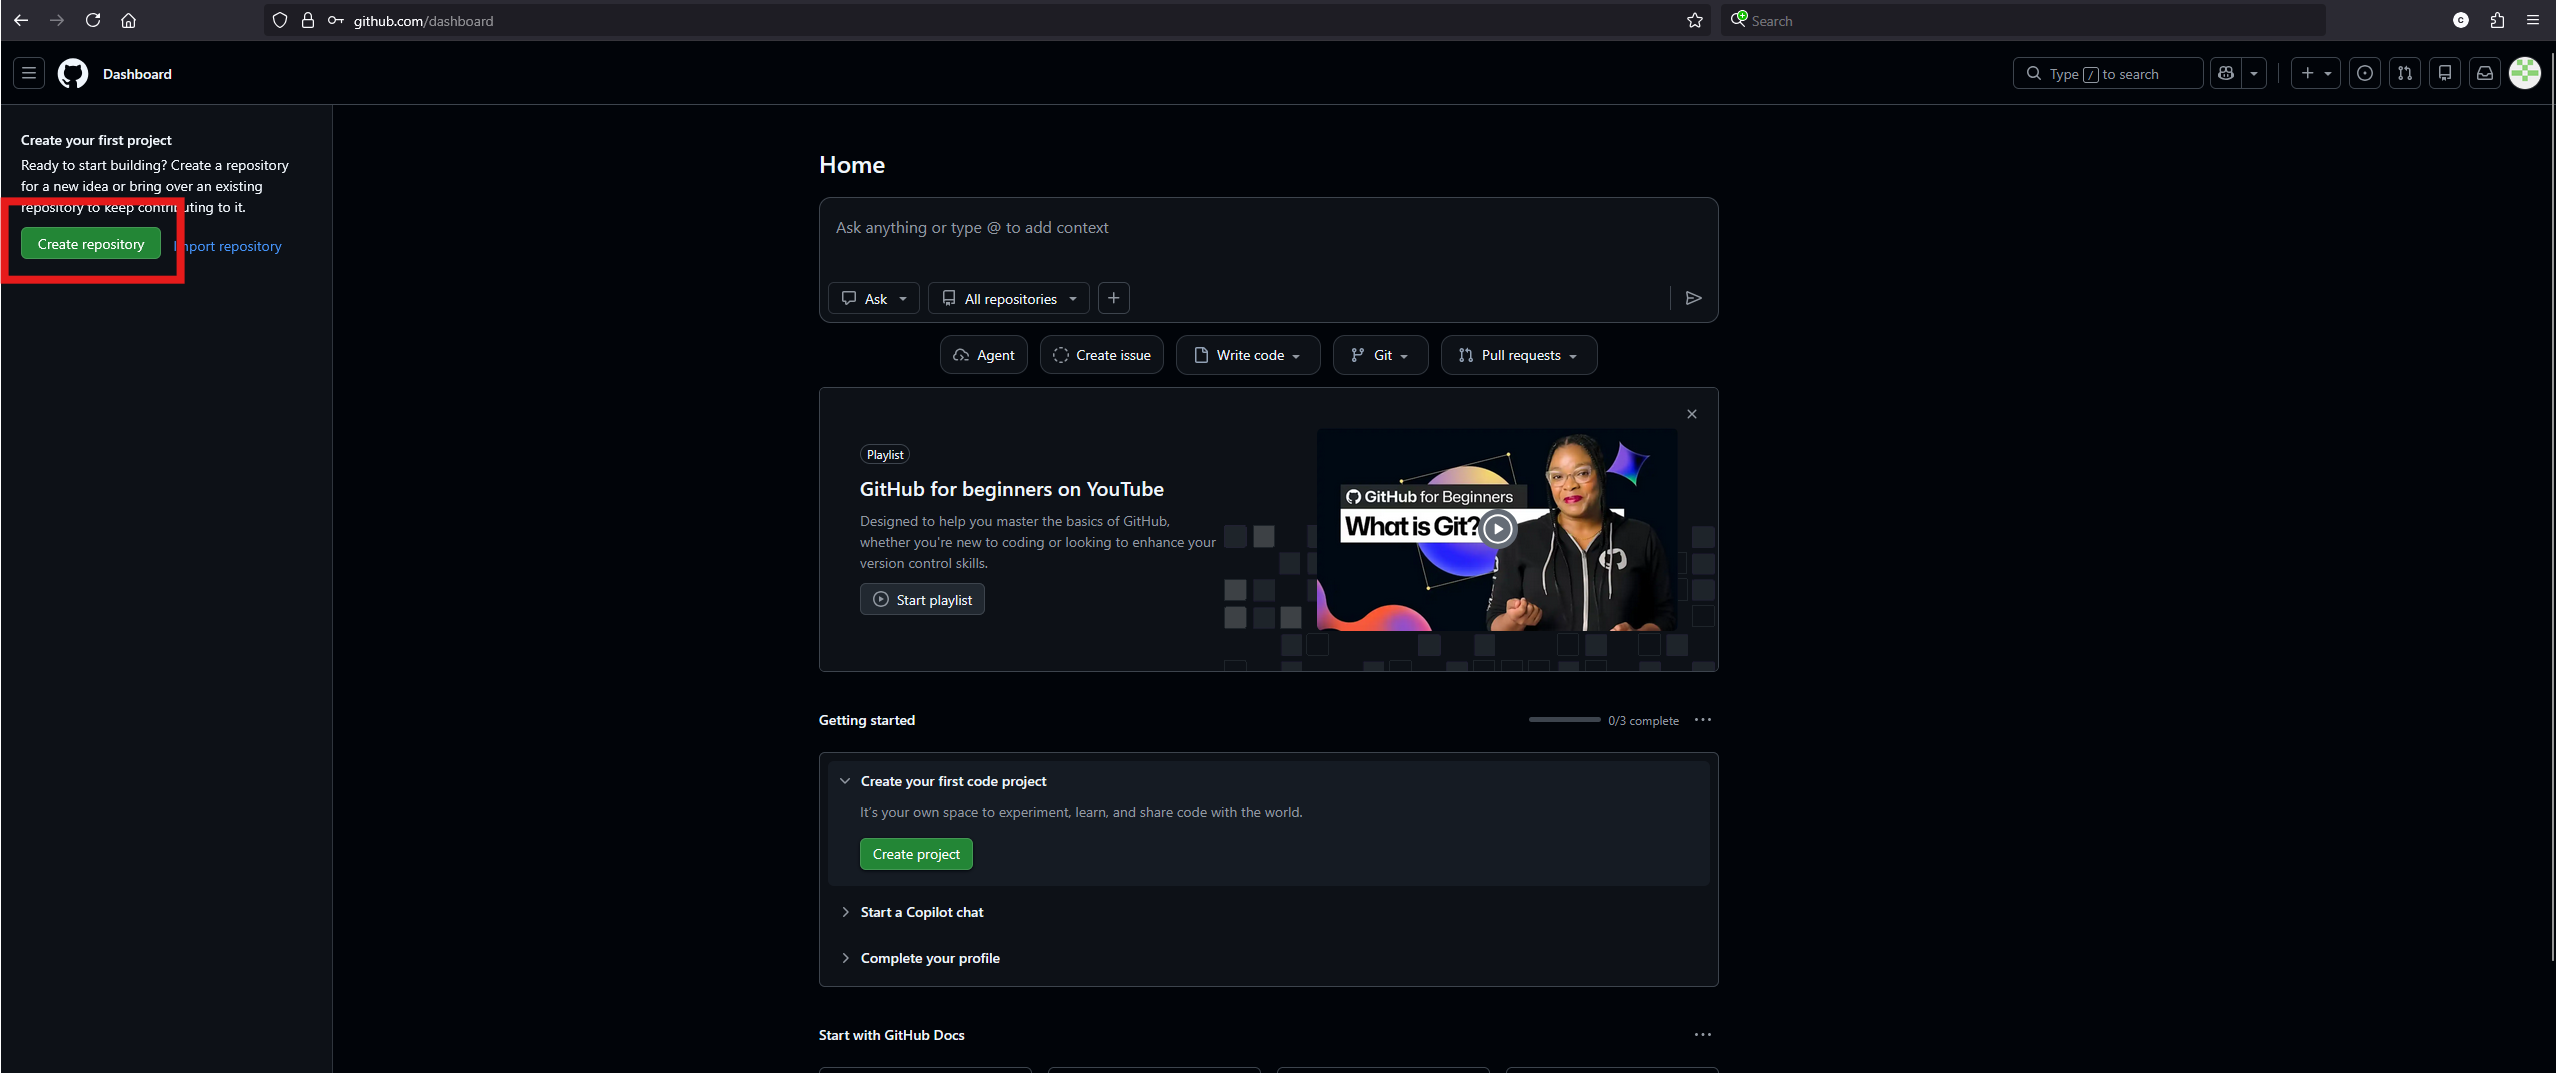
- In GitHub, the space where your project files live is called a repository. Click Create Repository to start your project.
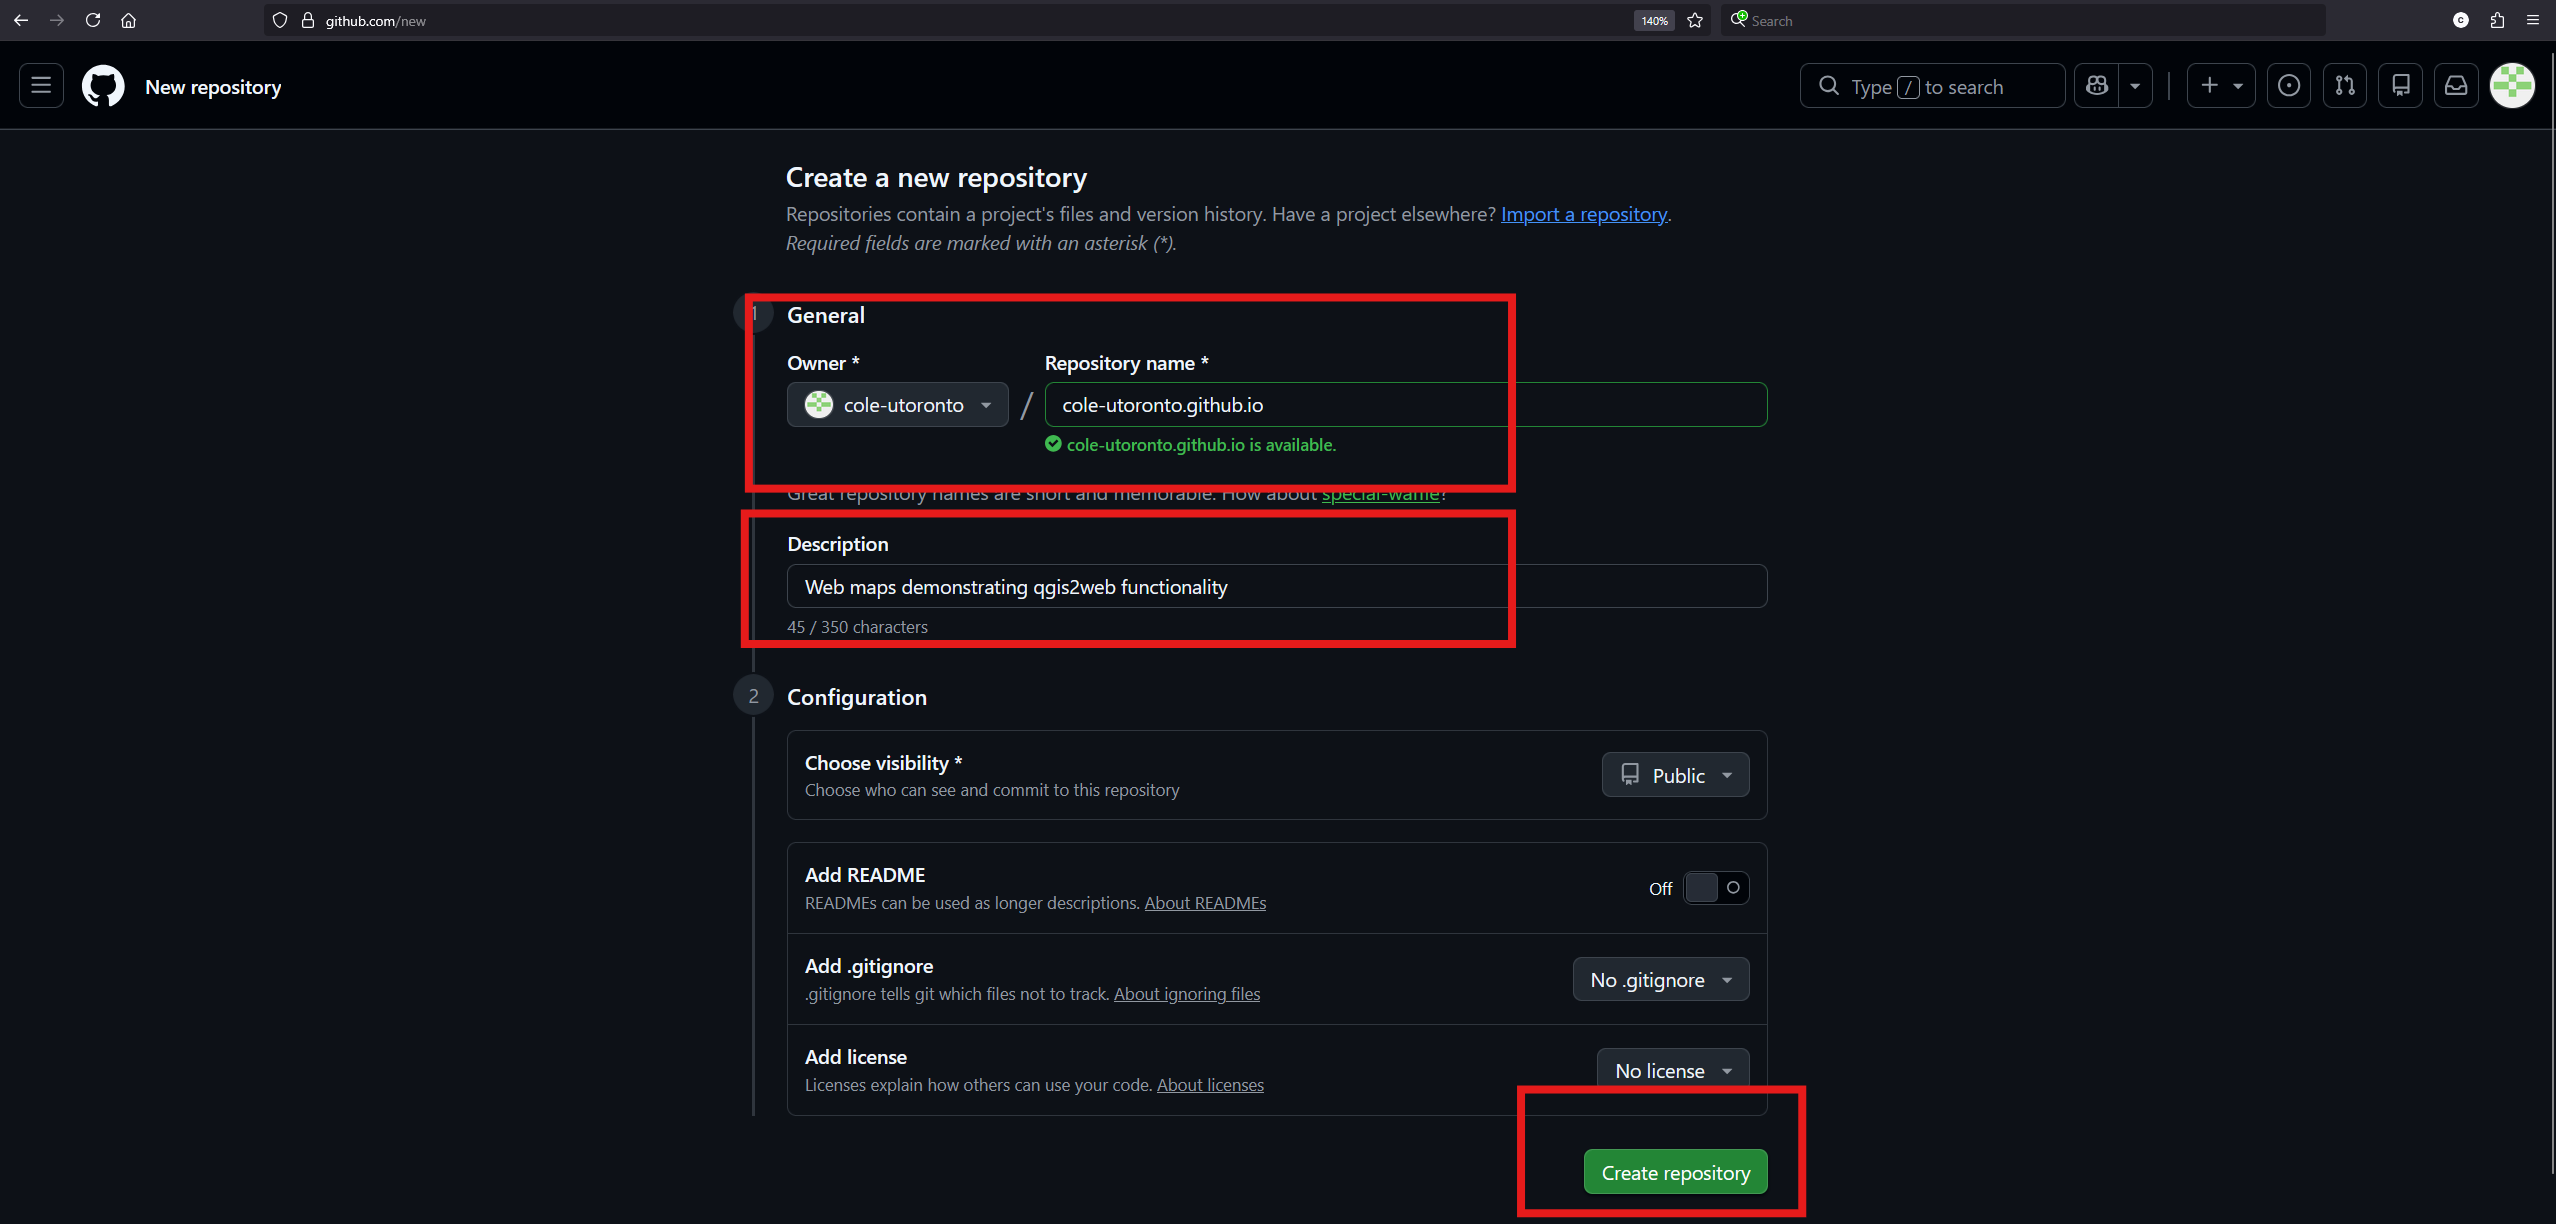
- For the repository title, input your username, followed by .github.io. This is the convention used in GitHub when you’re using a repository as the source of a website, rather than just uploading data. Add a description. Click Create repository.
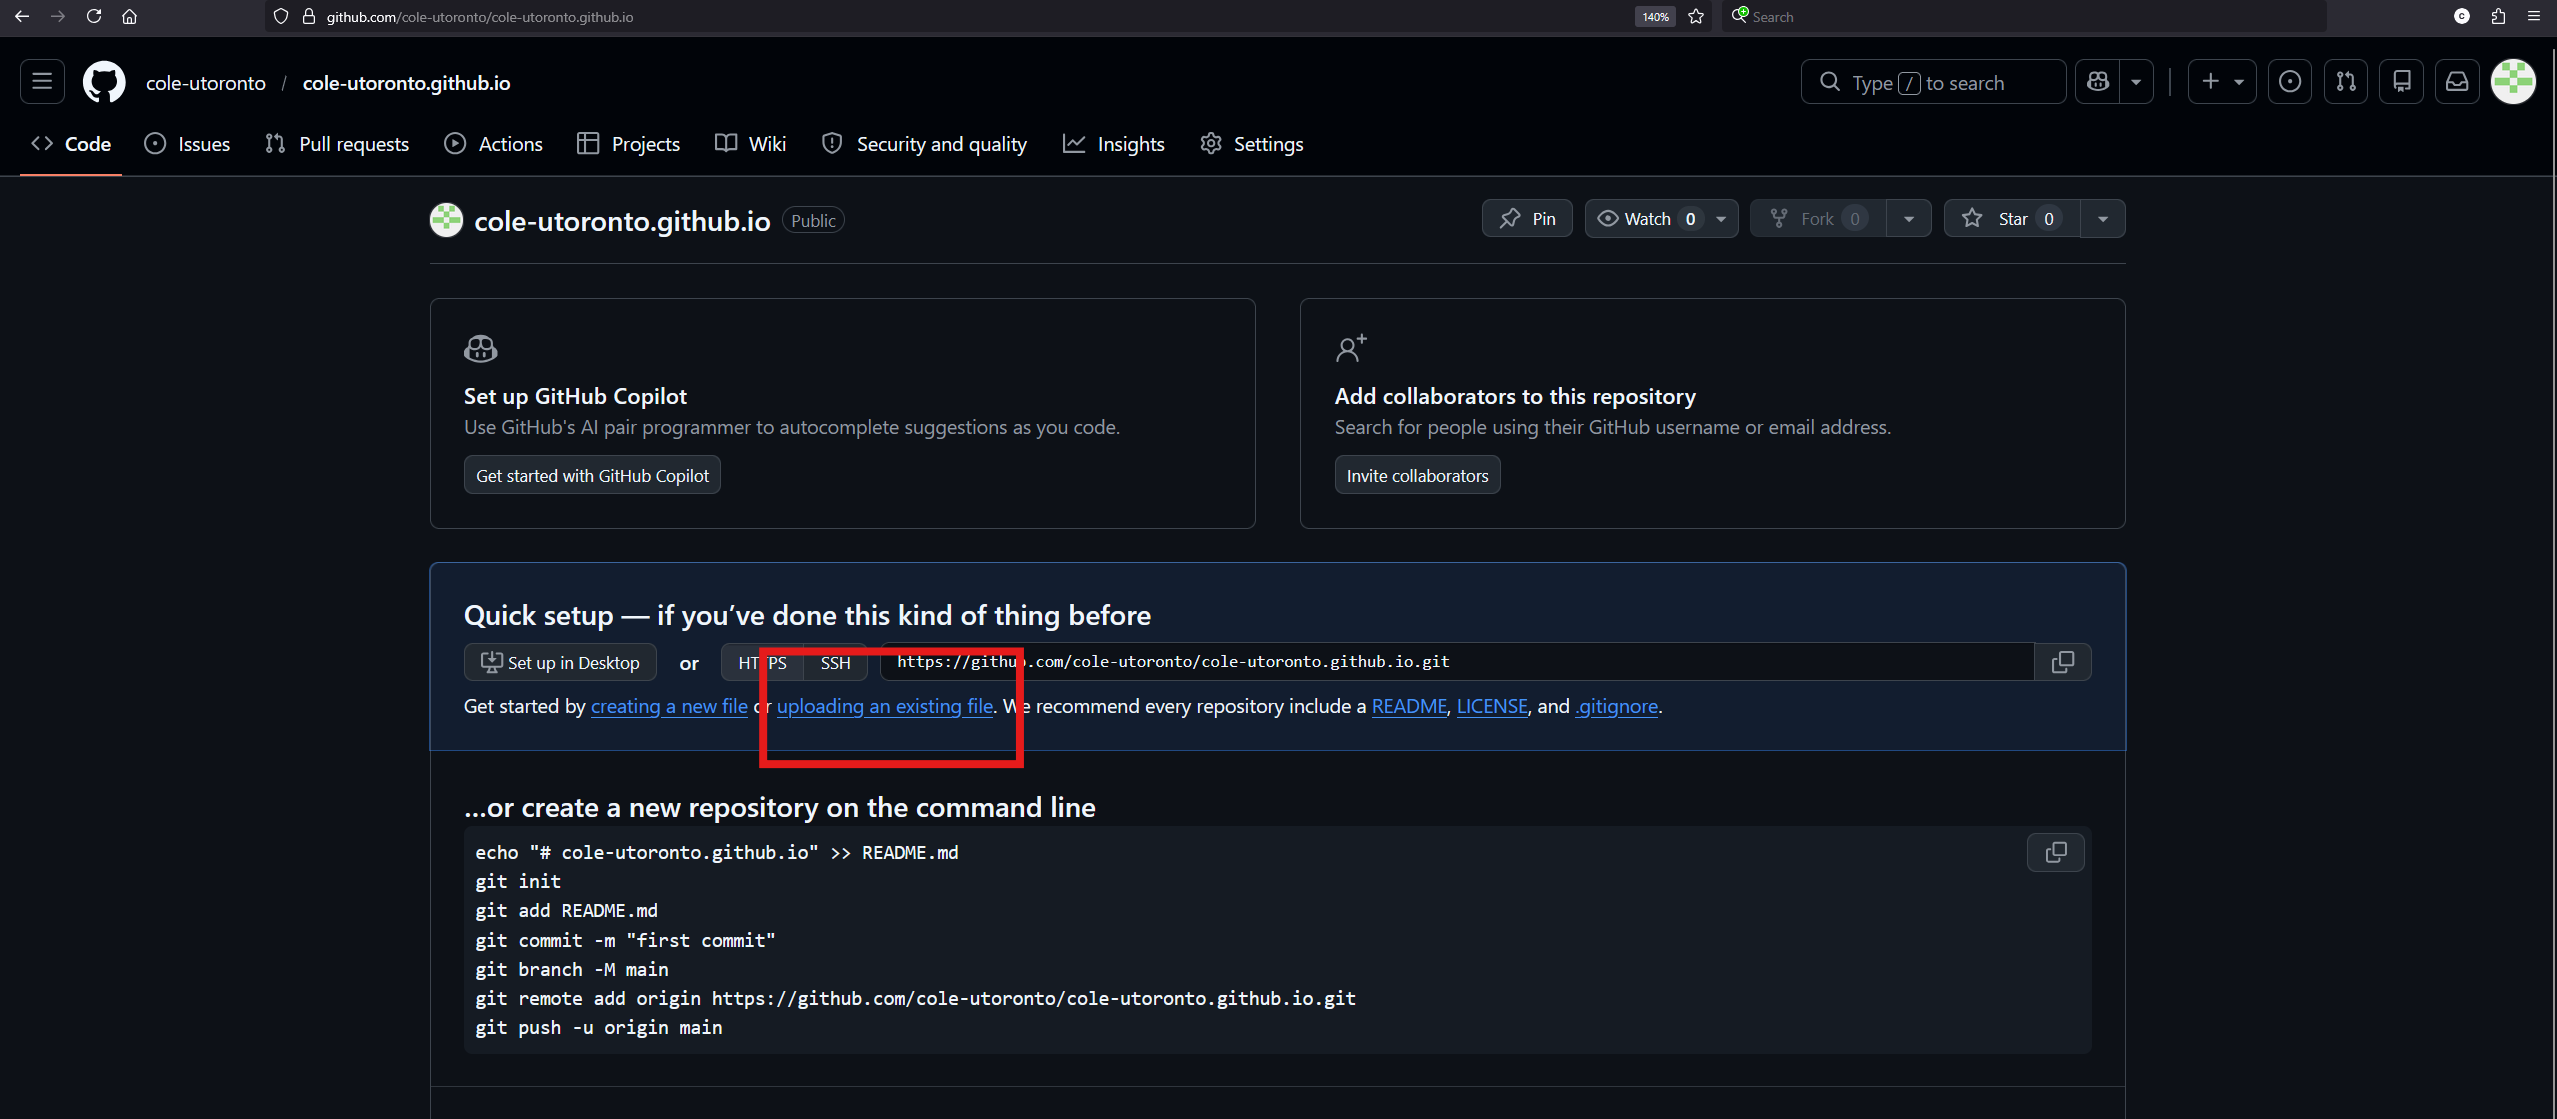
- Click the Uploading an existing file link.
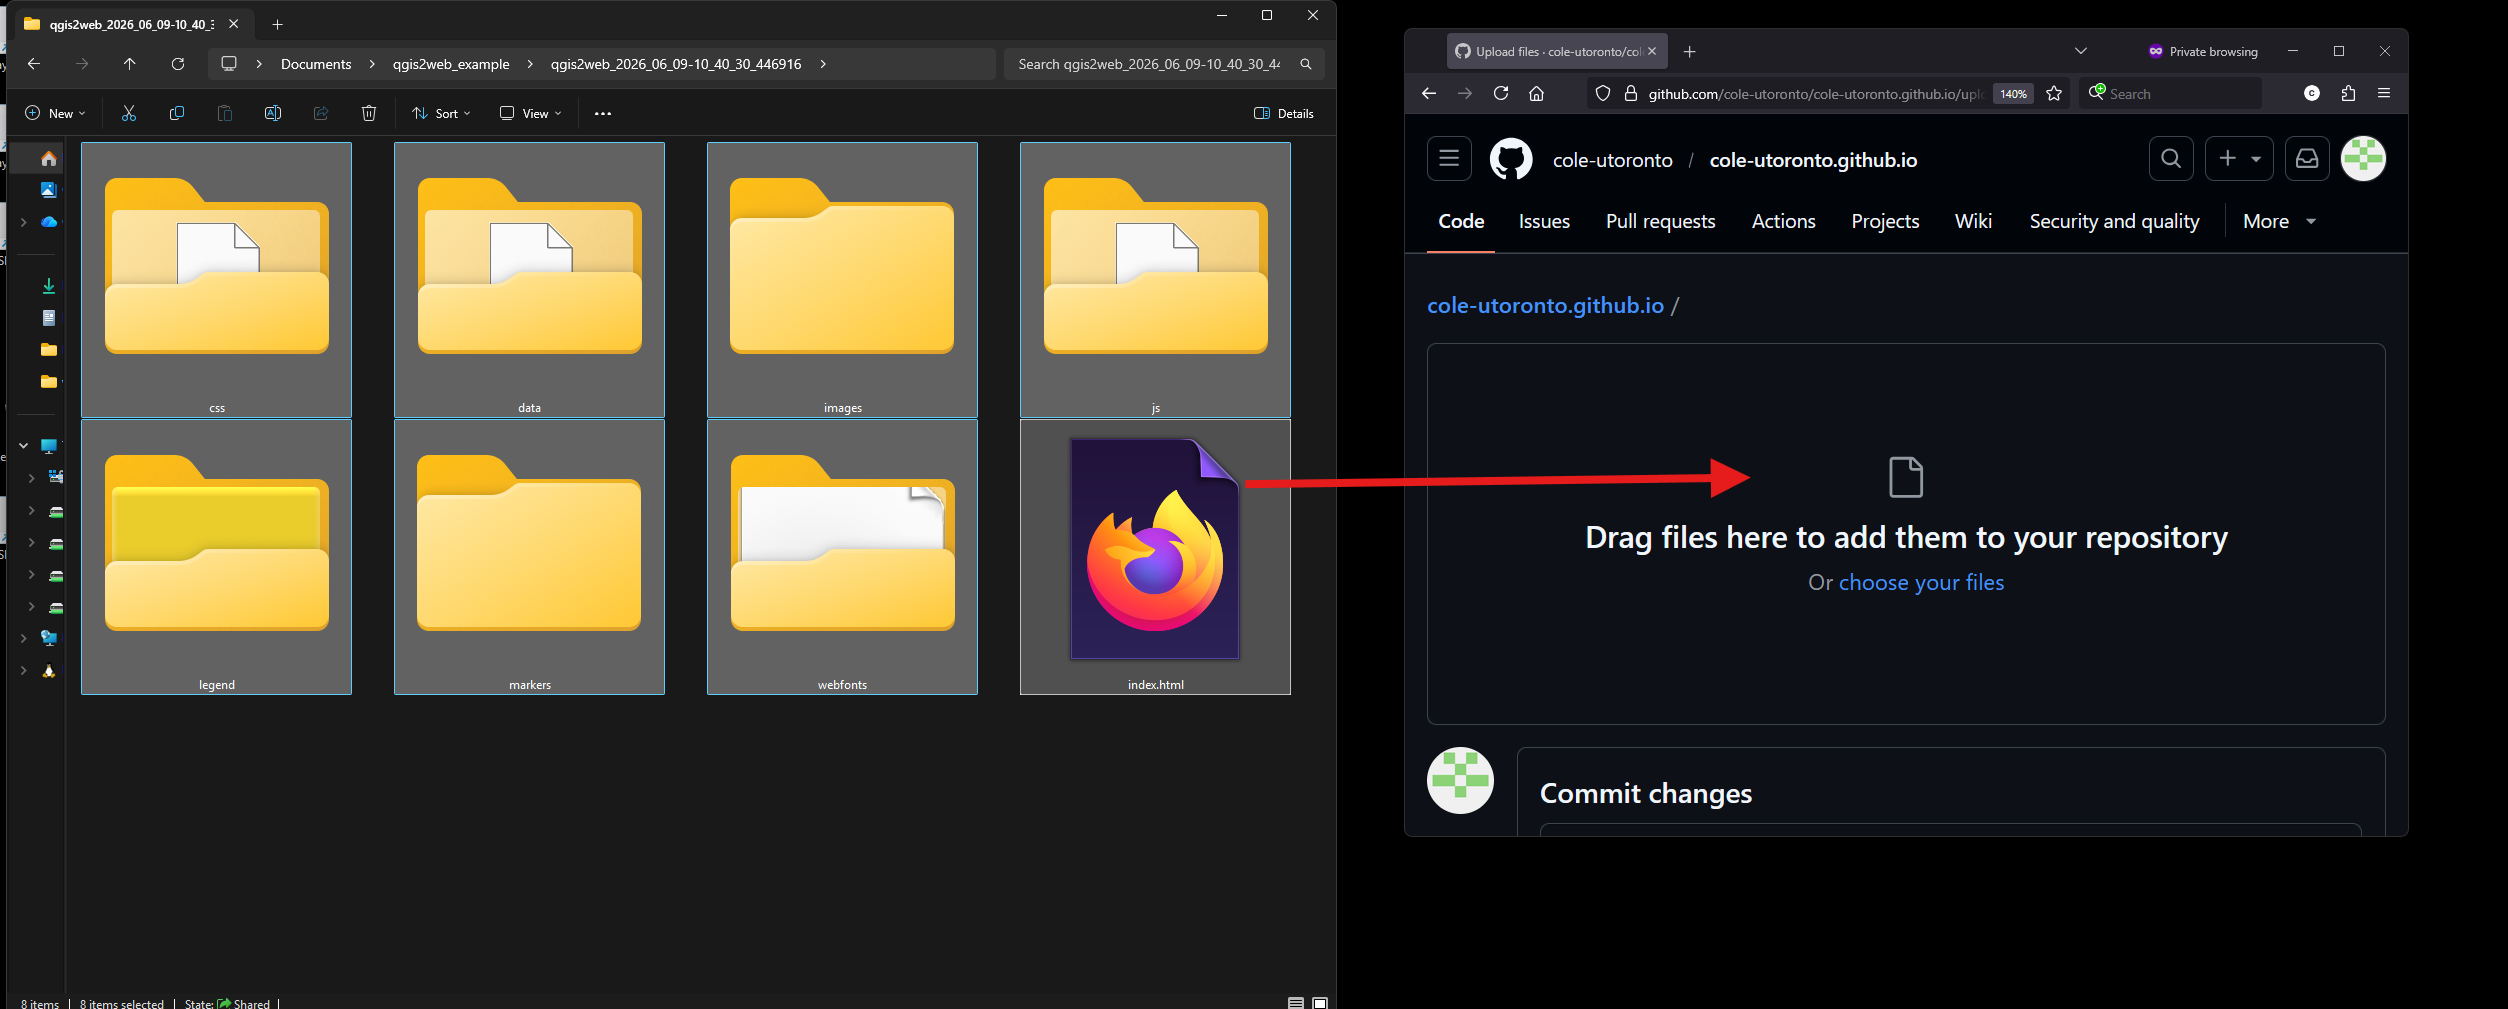
- Select everything in your qgis2web folder. Drag it into the GitHub page to upload the files.
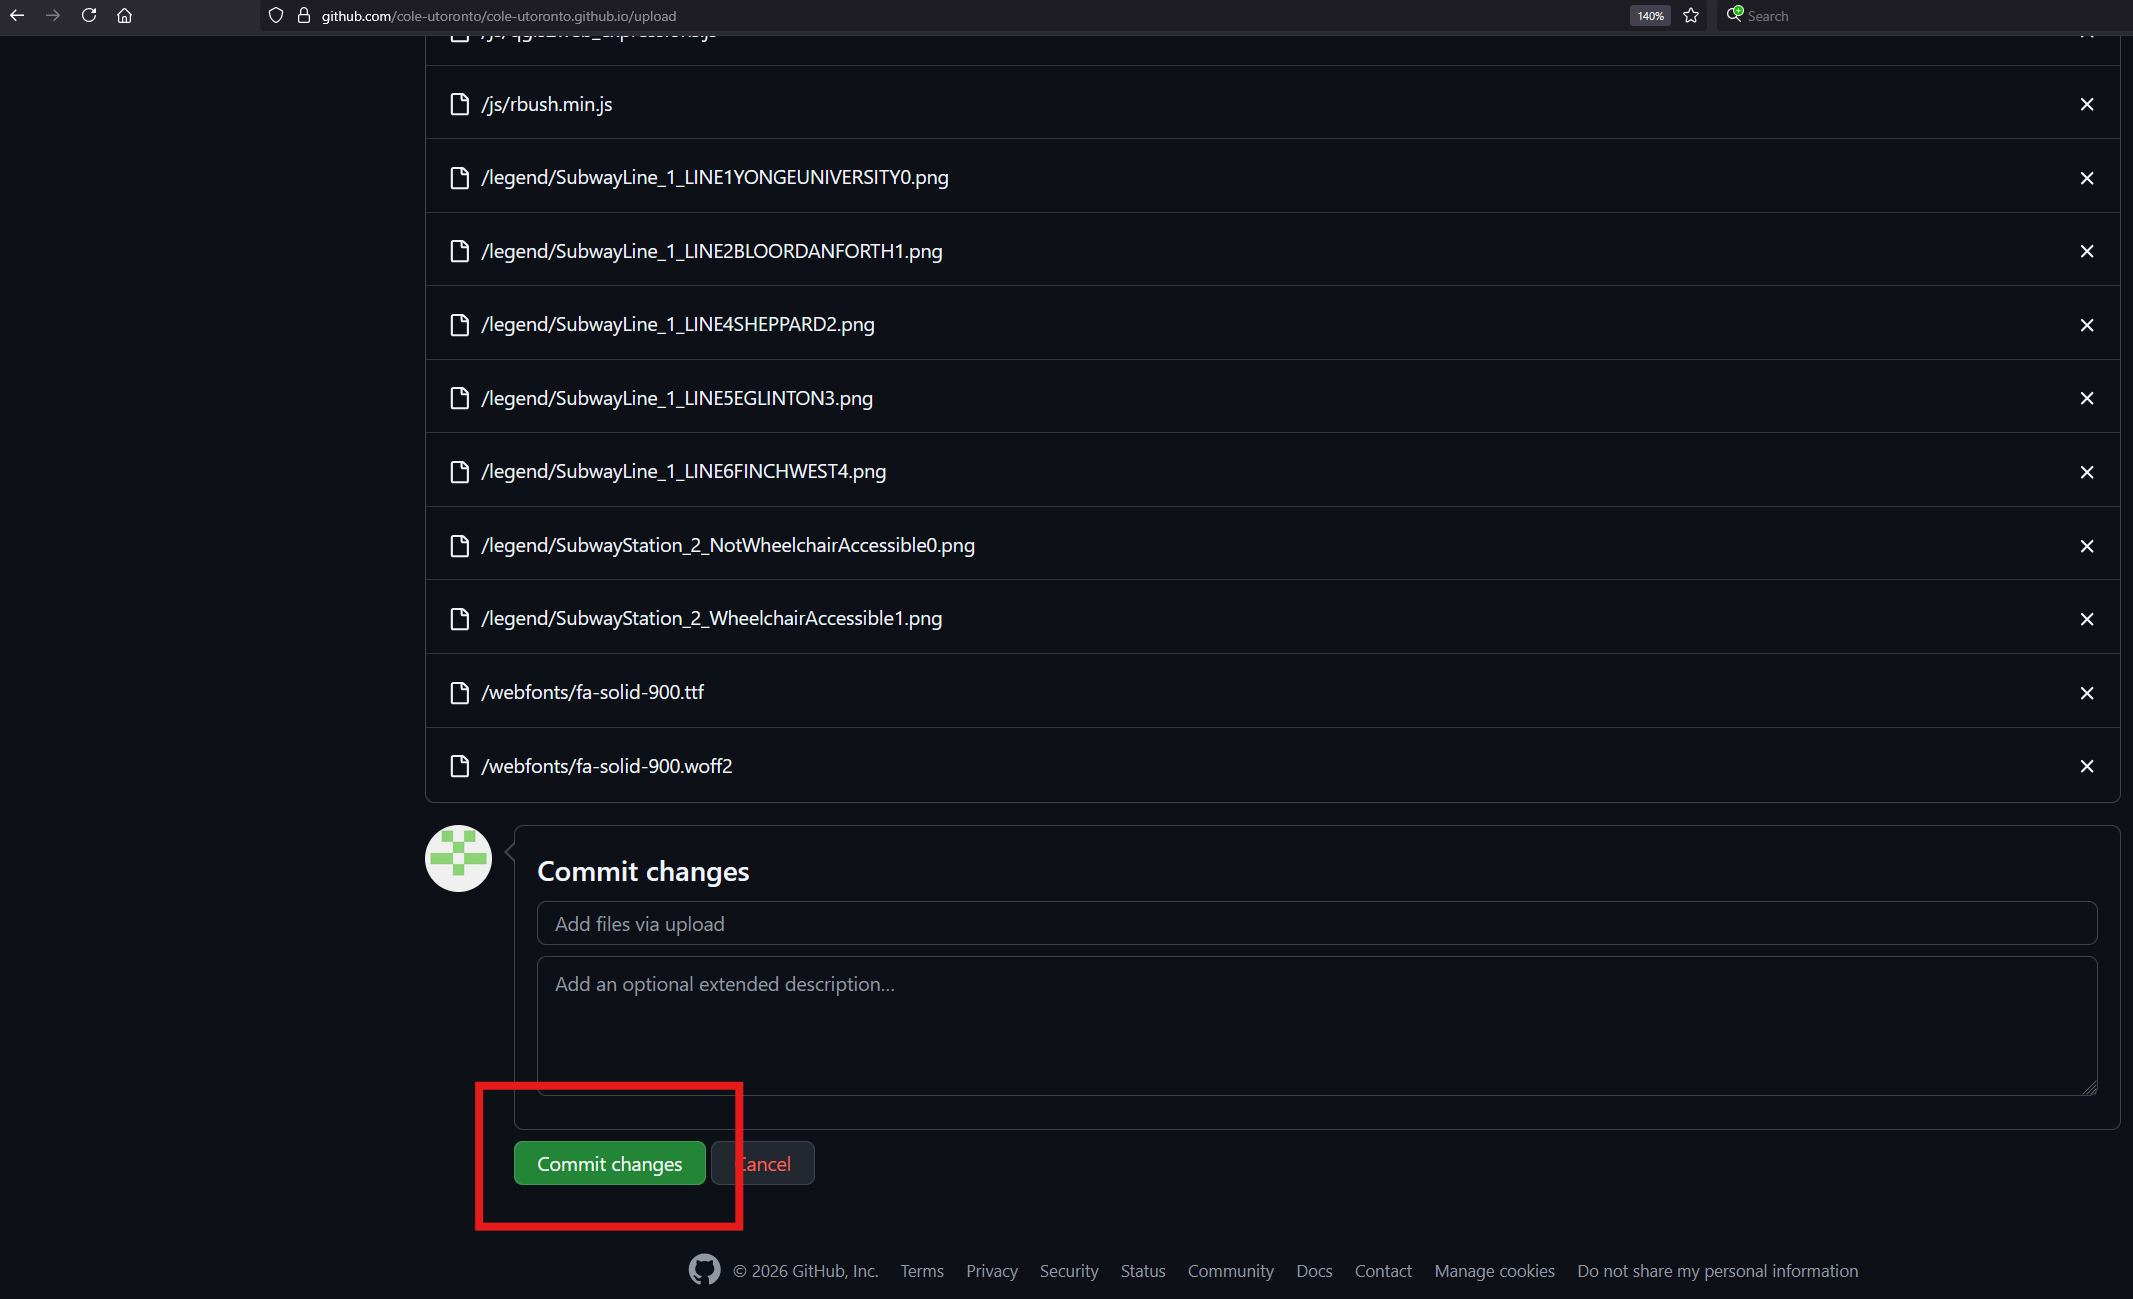
- Scroll to the bottom of the file uploader area and click Commit changes.
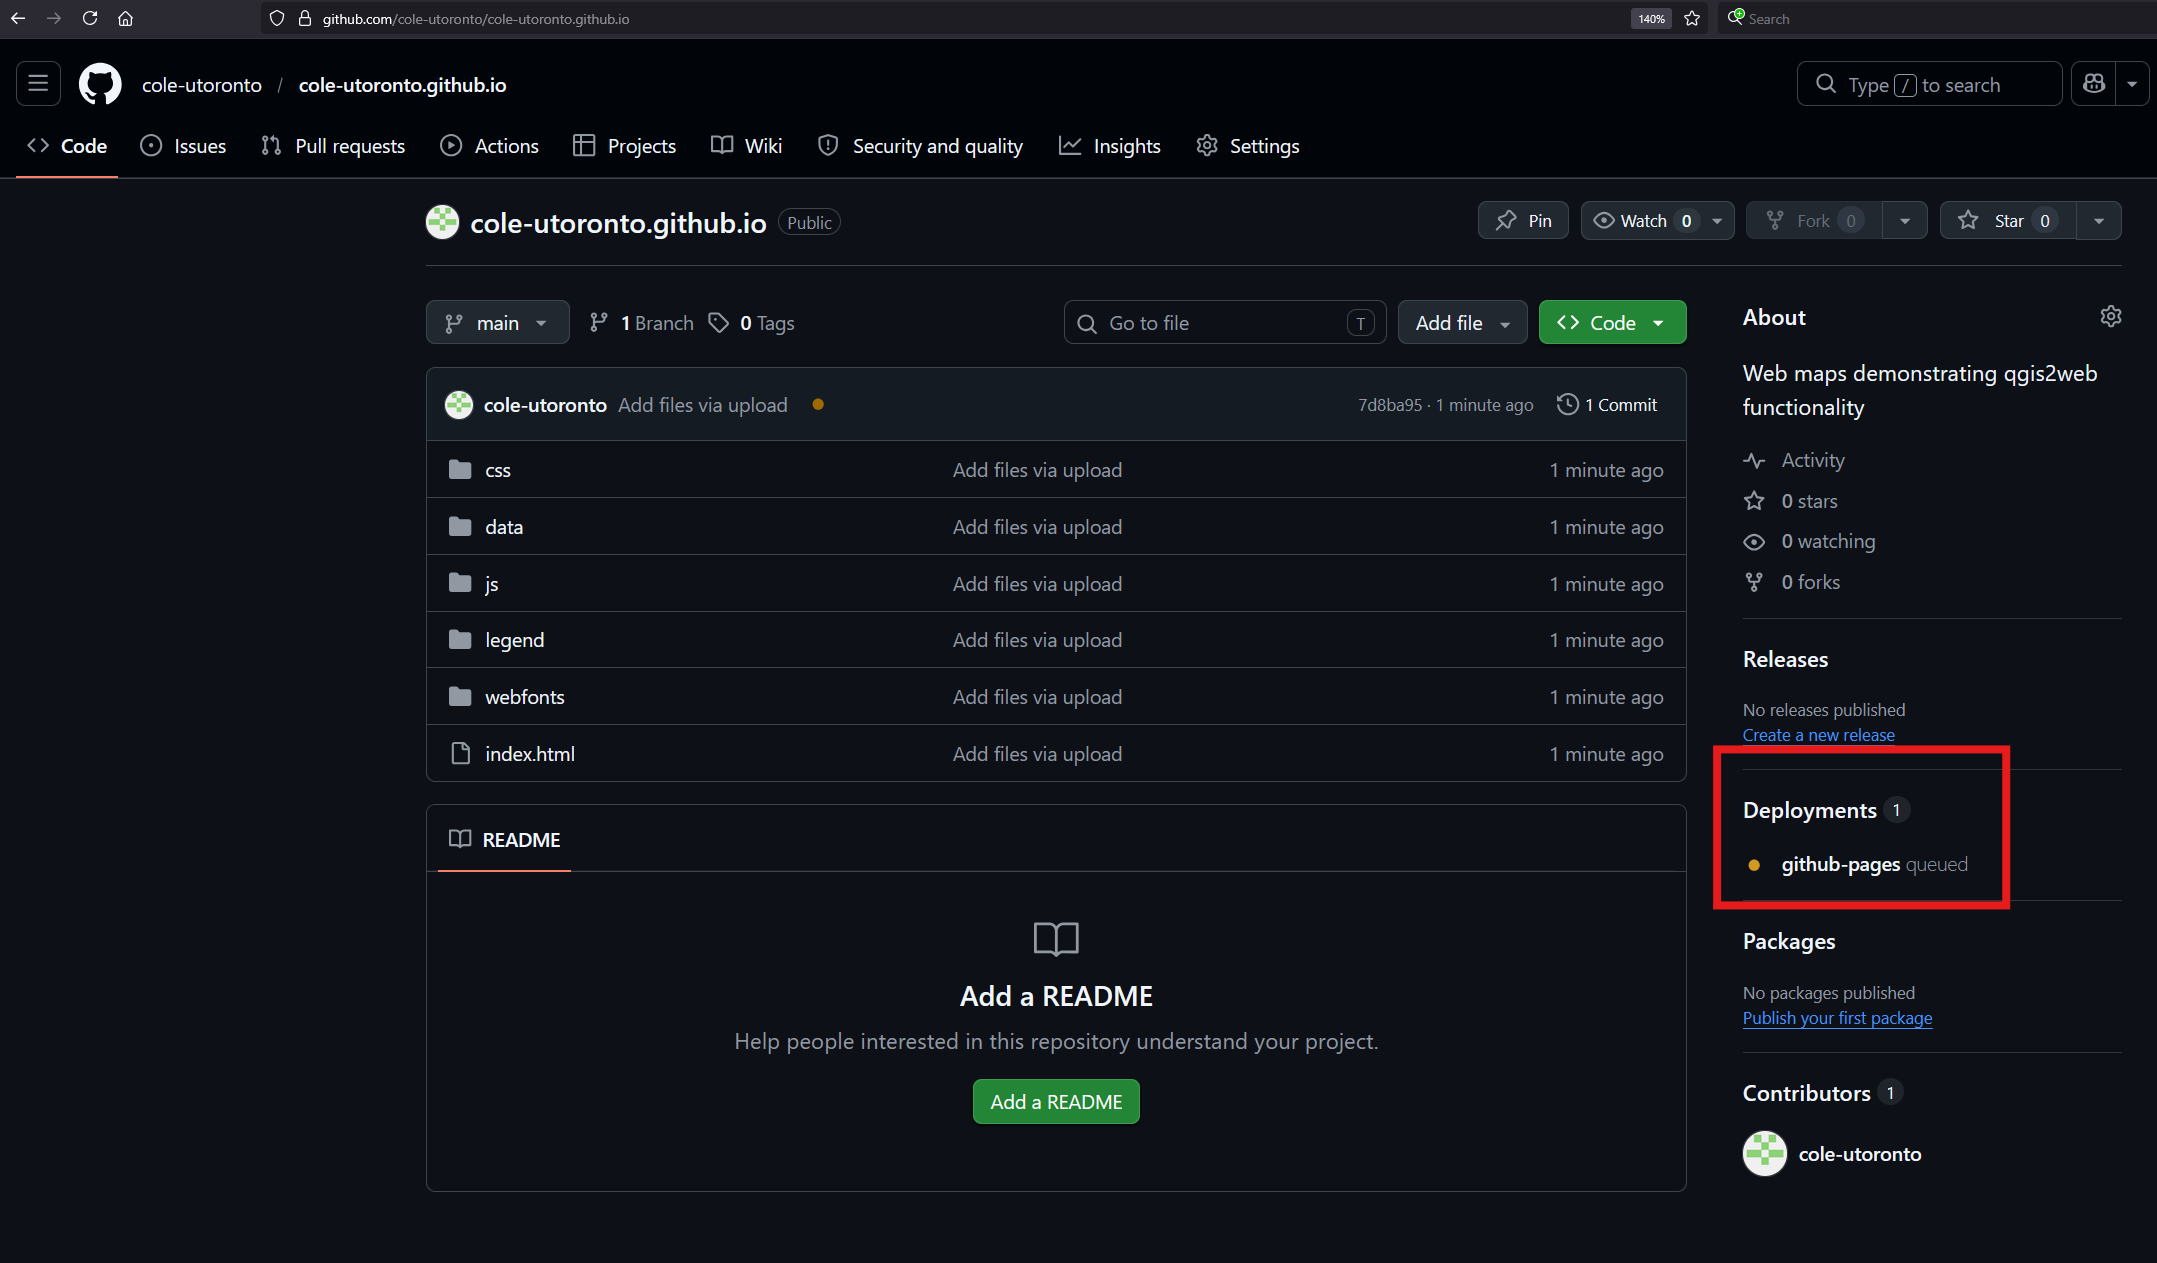
- Once the commit has been made, go back to the main page of your repository. You may see a note on the right of the page that the deployment is in process or queued. Typically, the deployment will complete within ten minutes.
- Once the deployment has completed, navigate to
your-username-here.github.io. Your map is now live on the web!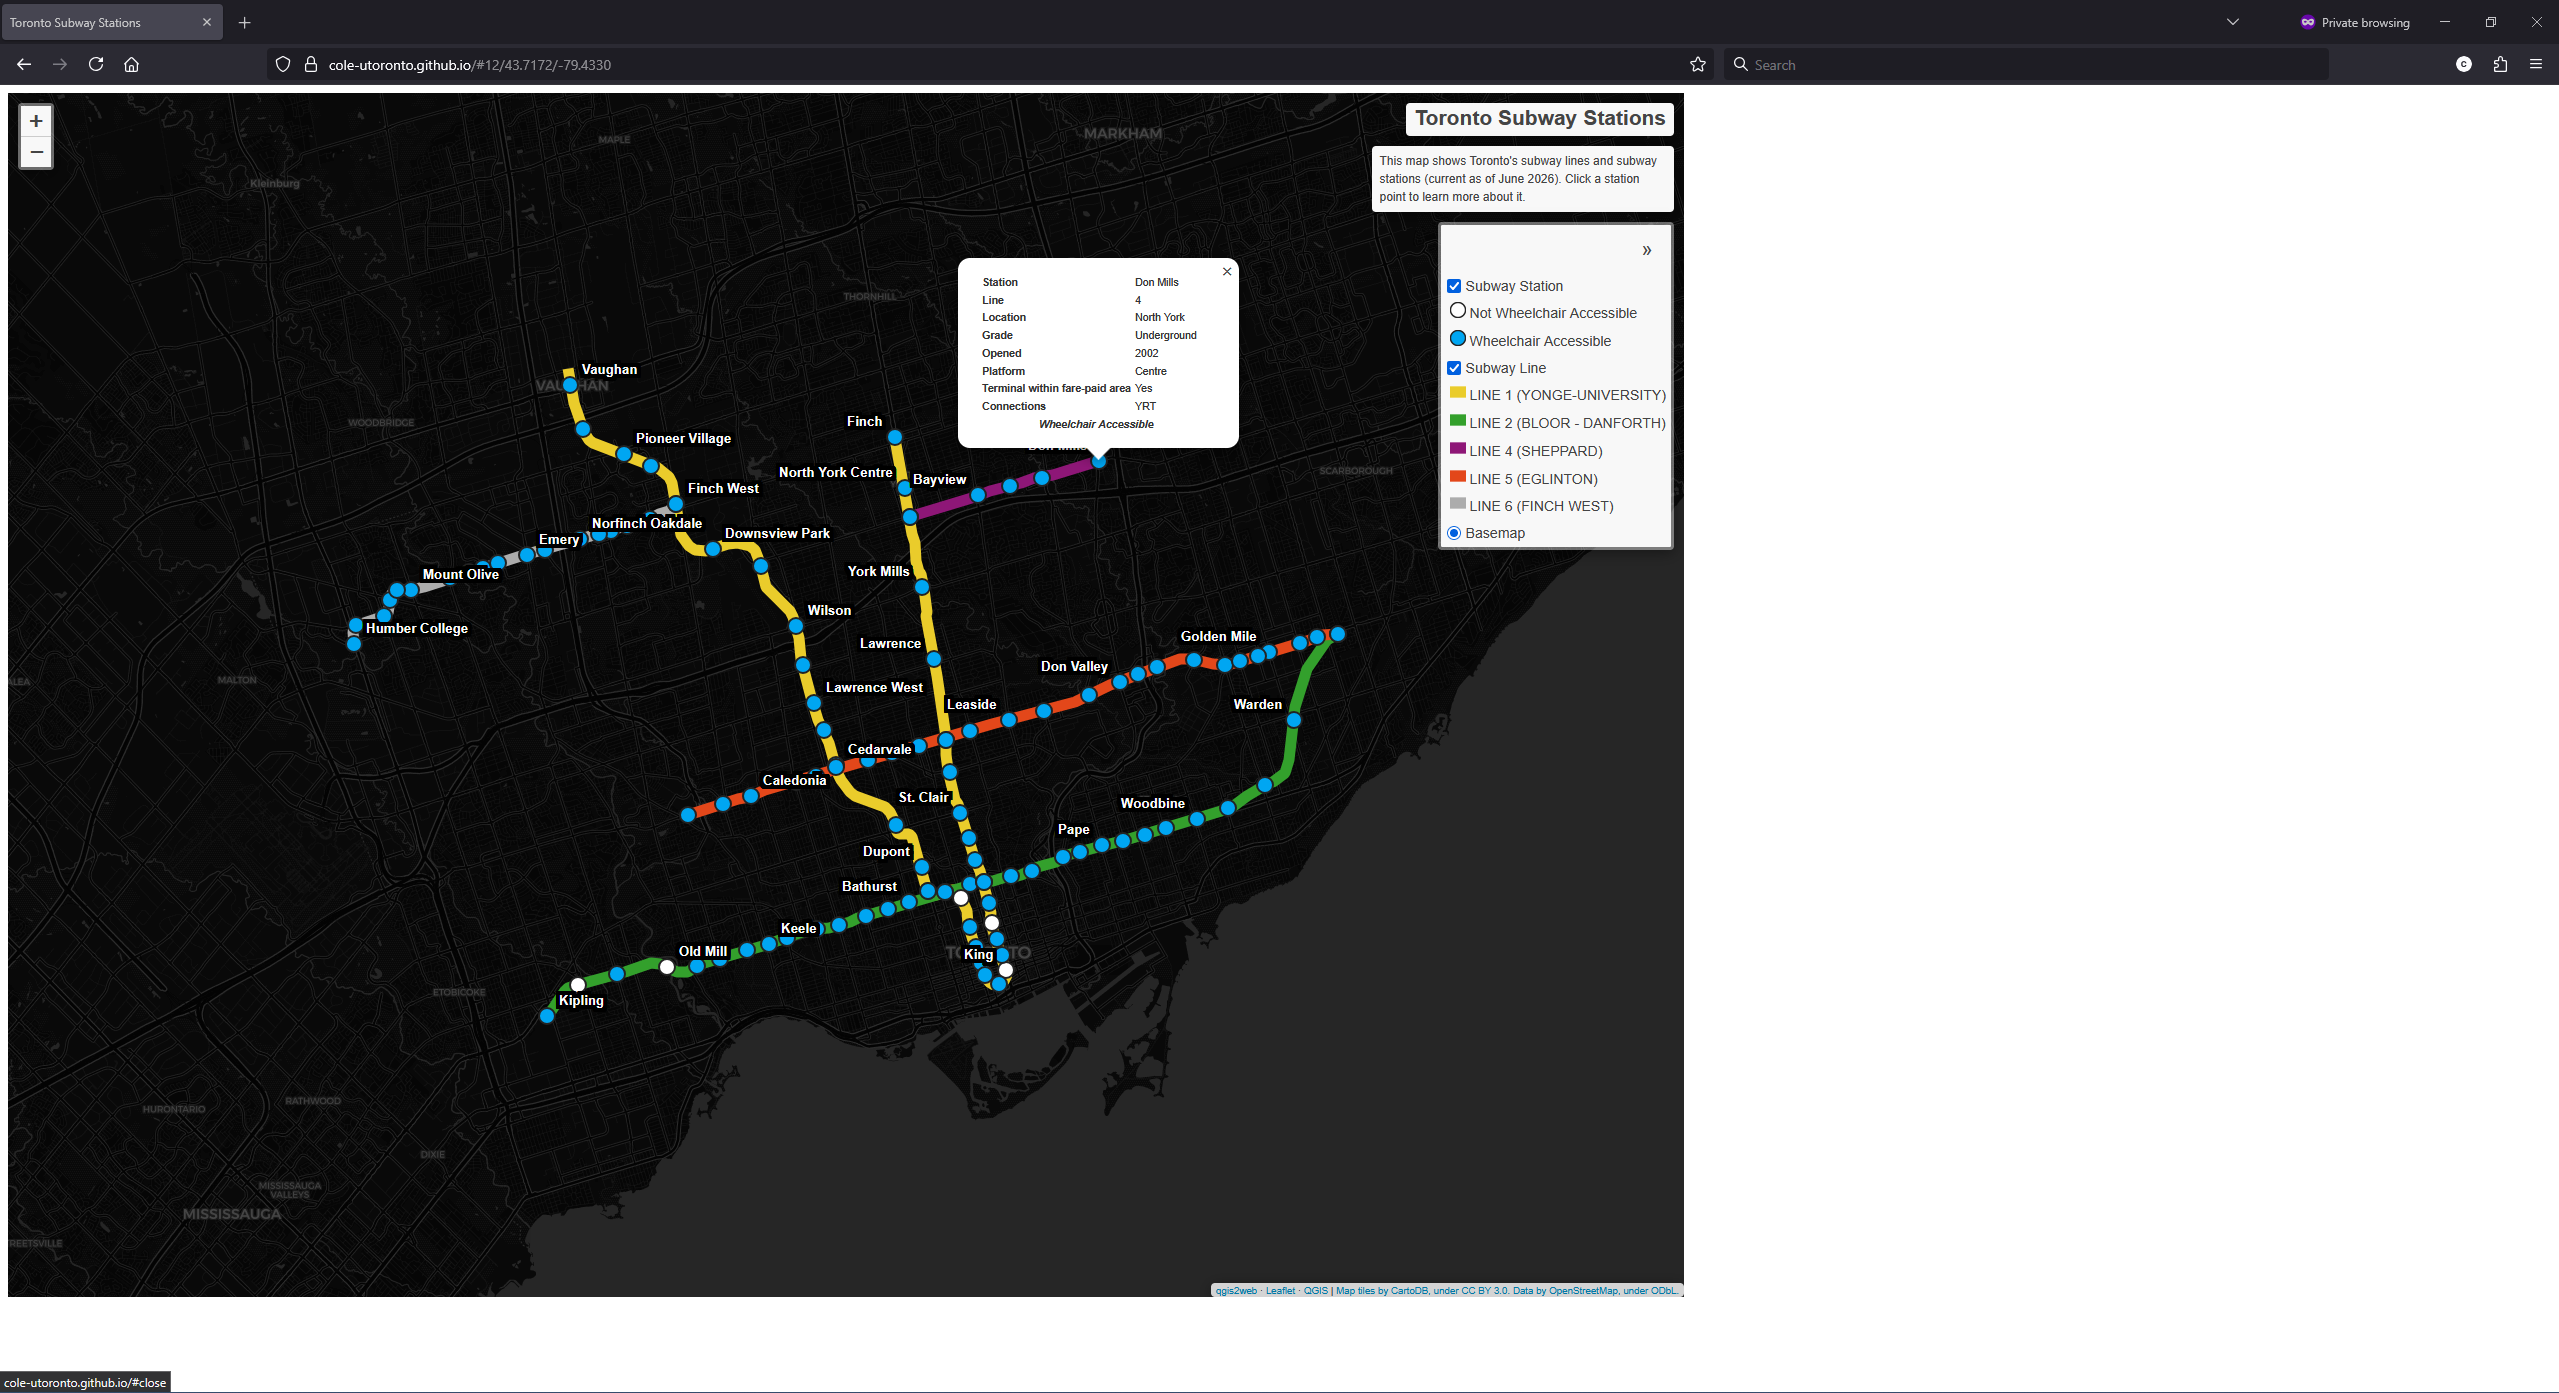
Resources
If you’d like to learn more about the tools and techniques used here, have a look at the links below.
QGIS
Introductory QGIS tutorial by the Map and Data Library
Learn HTML, CSS, and JavaScript
HTML is the most basic building block of the web, allowing you to define the structure and layout of your content. CSS gives you more control over how your HTML looks, and JavaScript allows you to add interactivity and logic to your creations. The basics of all three are easy to learn, and will enable you to further customize your digital projects.
Leaflet
- Official website containing documentation, tutorials, and plugins.
GitHub
- GitHub for Beginners blog post series.
Other helpful links
- O’Reilly: Access tech how-to ebooks online using your UTORid.
- LinkedIn Learning: Use your public library membership to access self-guided learning materials for free.
- Contact the Map and Data Library if you have questions or would like assistance with anything.