Saving and Publishing
Now so far we’ve been creating one visualization per page. But normally you use a page to combine a number of visualizations together to present a more complex story than a single visualization can show. You can then also use the Insert menu to add text, images, etc. to create a final report.

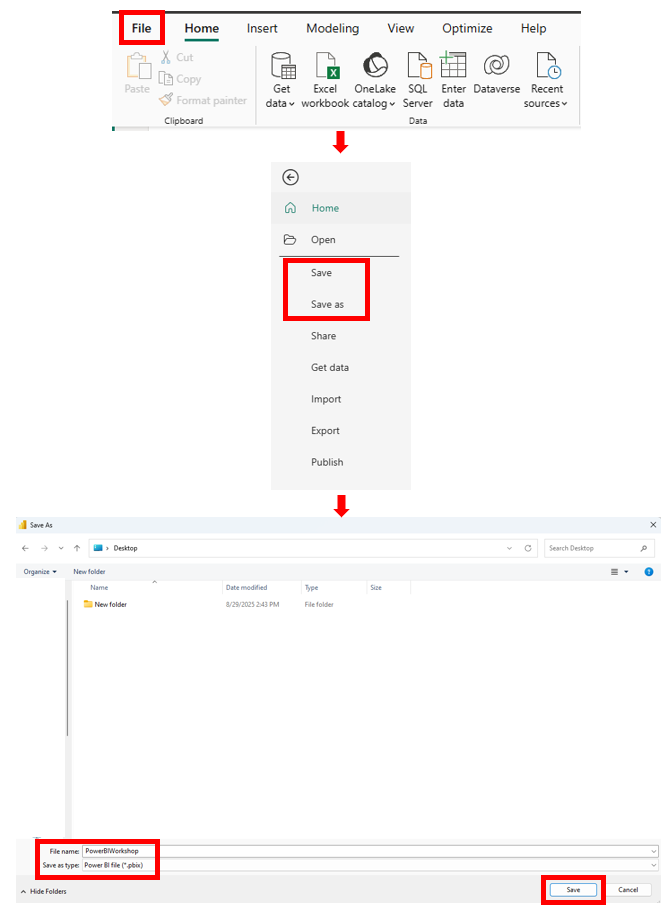
Once you’ve created some reports, your last steps are to save and publish them. If you’re working on some visualizations, like we have here, you can save work-in-progress as a Power BI Workbook file. Go to the File menu and click on Save. Give it a name and select where you want to save the file. You can then come back to revisit your work later by reopening it in Power BI.
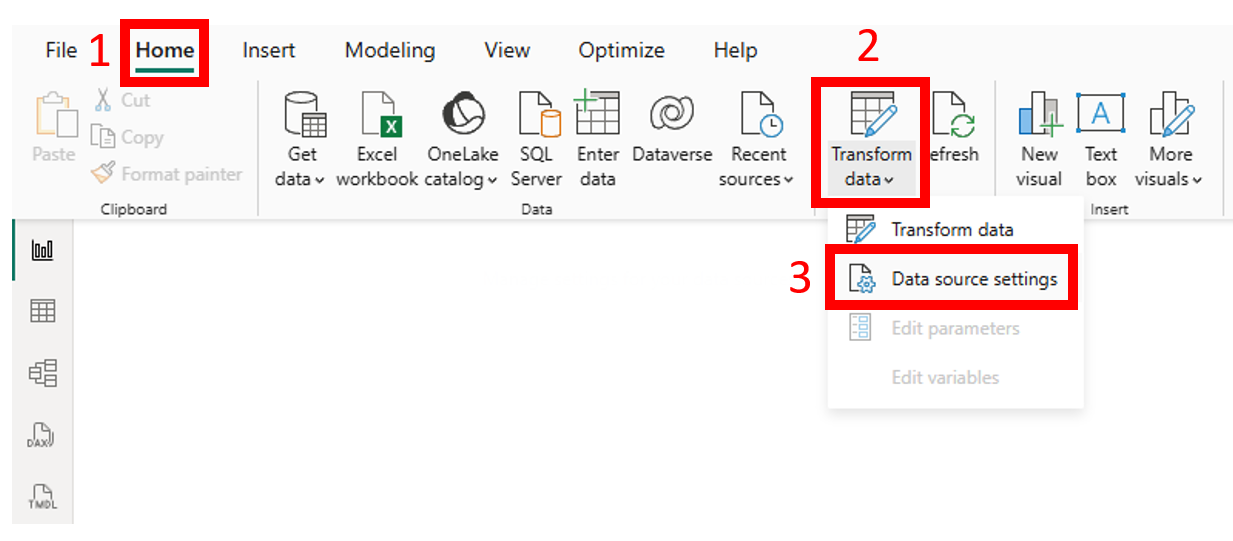
It does seem to store the data in the project file, so you can share it with another user(s). But there could be issues if it wants to refresh the data. I have better luck if I share the workbook file and the data files together. If you keep them in the same folder, it should work fine. If the path to the data files changes, go to the dropdown menu for Transform data from the Home menu and select Data source settings. Here you can correct the path to the data files, if you’ve moved them.
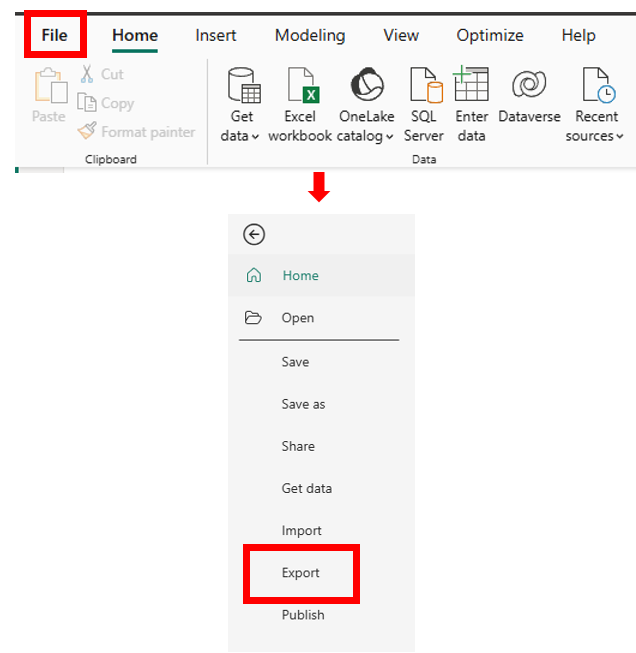
You can also export your report as a static PDF. To do so, go to the File menu and choose Export, Export to PDF. This will save all the pages of your report into one PDF file.
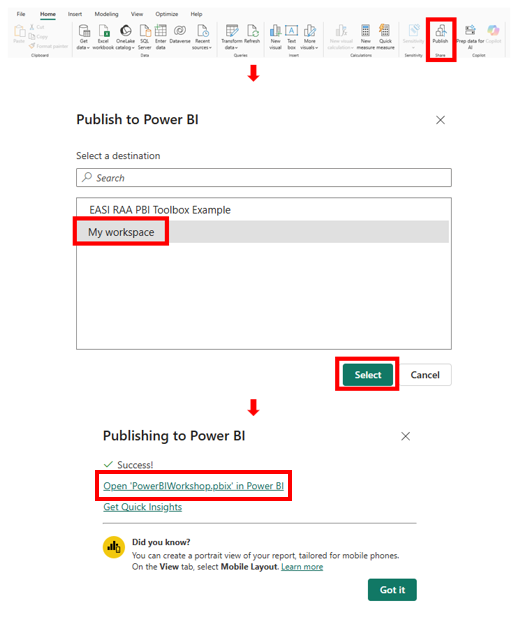
Note: As our dashboard, and visualizations can also be interactive, there may be times when you want to publish them to the web so that your users can view them. As a student using the free version of Power BI, unfortunately, your options are limited. Click on Publish from the Home menu, choose My workspace, and click on Select. After it uploads, it’ll give you a link to open up the report in the Power BI Service online space. You can view it and interact with it here on the web.

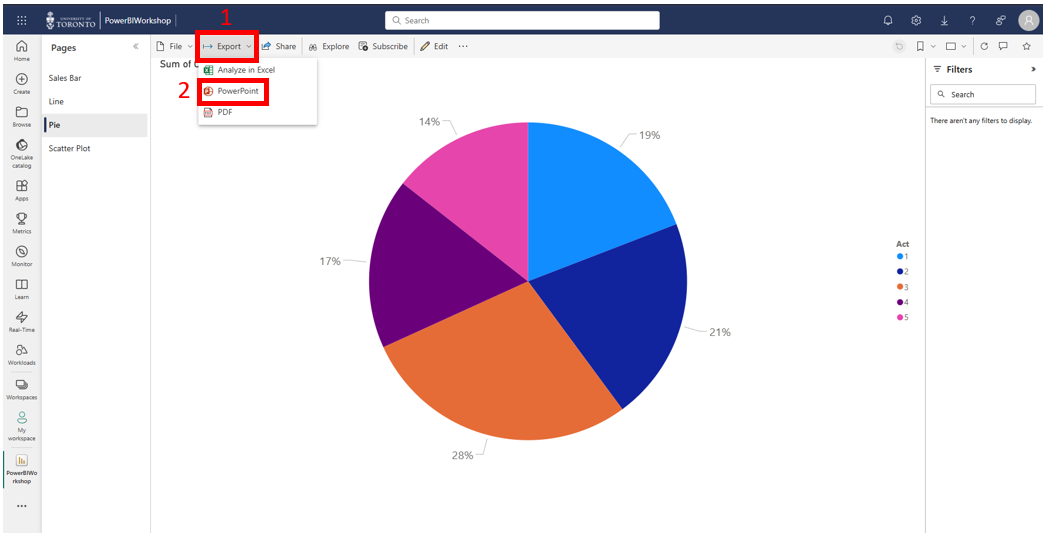
You can also use the Export option here to export it as a PowerPoint presentation. But again it’ll be static images.
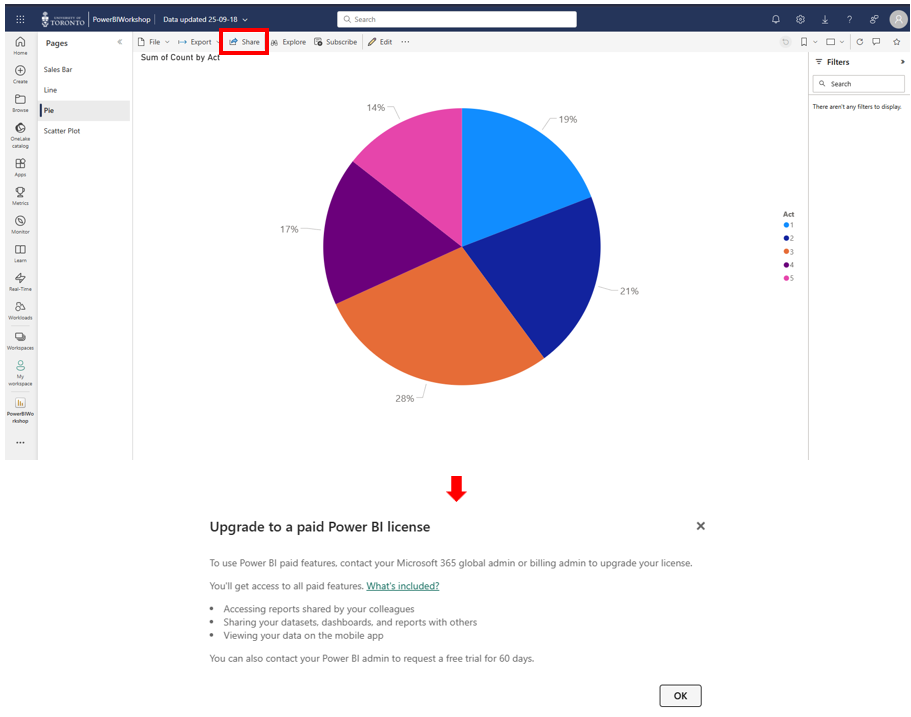
If you have the paid version of Power BI, here is where you would be able to share this report with others, but unfortunately, if you try to click on Share as a student, you will get a message saying this is a paid feature. Basically with the free version of Power BI, your only option to share an interactive version of your report, is to share the workbook file and require the recipient to have Power BI as well and view it from within the tool.
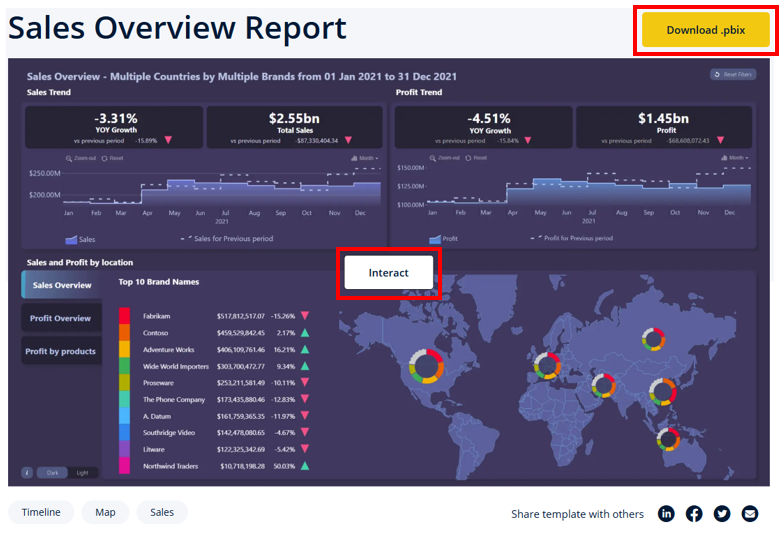
To wrap up, I also just want to show you some examples of what a final Power BI report might look like. You can Google to find lots of good examples online. Here is an example from Zoom Charts. When you click on an example you’re interested in, you can not only interact with it, but also download the Power BI workbook file to see how it was done. A great way to learn!
And that’s it!
Technique: Data Visualization | Tools: Power BI | Data Format: Statistics