1. Point Features
This tutorial will show you how to work with point, line, and polygon features in R. Let’s start with point features. This section will show you how to create a point feature dataset from scratch and then make a map of it.
In this section, we want to create a spatial dataset of four museums from scratch. First, we create three lists of the longitude values, latitude values and museum names for four museums of interest. To create a list in R, you can use the c() function. We keep the order of museums in each list.
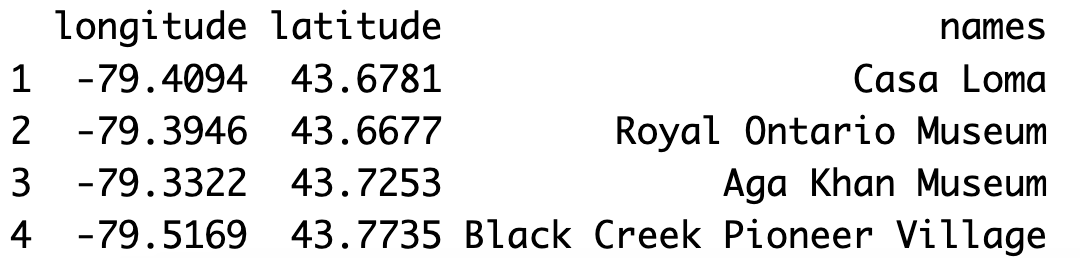
Then we combine these three lists using the data.frame() function to create a new dataset. We call this dataset or data frame museums. When we run museums by itself, we can see the three columns longitude, latitude and names for the four museums.
# 1. Point Features
# Creating data using longitude/latitude pairs and names of places
longitude <- c(-79.4094, -79.3946, -79.3322, -79.5169)
latitude <- c(43.6781, 43.6677, 43.7253, 43.7735)
names <- c('Casa Loma', 'Royal Ontario Museum', 'Aga Khan Museum',
           'Black Creek Pioneer Village')
# Convert list to dataframe
museums <- data.frame(longitude, latitude, names)
museums
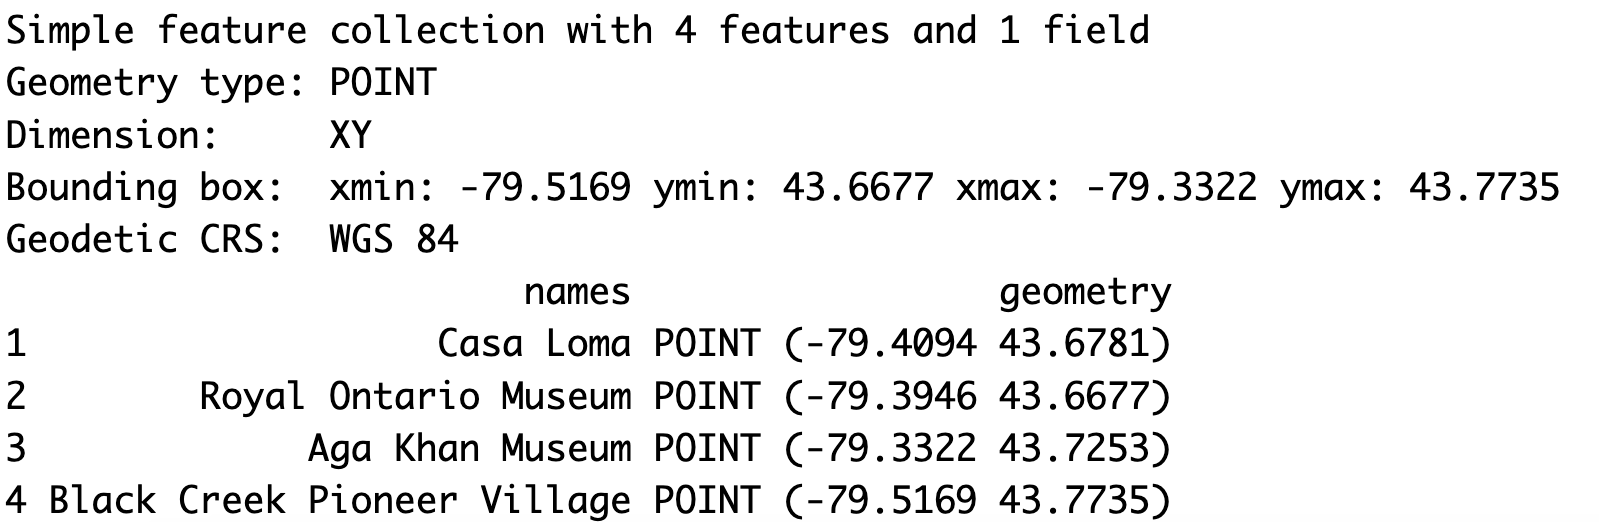
To convert the museums data frame to a spatial dataset or a sf (simple features) object, we use the st_as_sf() function. Inside this function, we specify the museums dataset. Then using the coords argument, we specify the longitude and latitude variable names in our dataset as a list using the c() function. We also specify the coordinate reference system using the crs argument. We save the converted spatial dataset as museums_sf.
Now, when we run museums_sf by itself, we can see that it is a simple feature object with four point features and one field or variable called names.
# Convert dataframe to sf object
museums_sf <- st_as_sf(museums, coords=c("longitude", "latitude"),
                     crs="EPSG:4326")
museums_sf
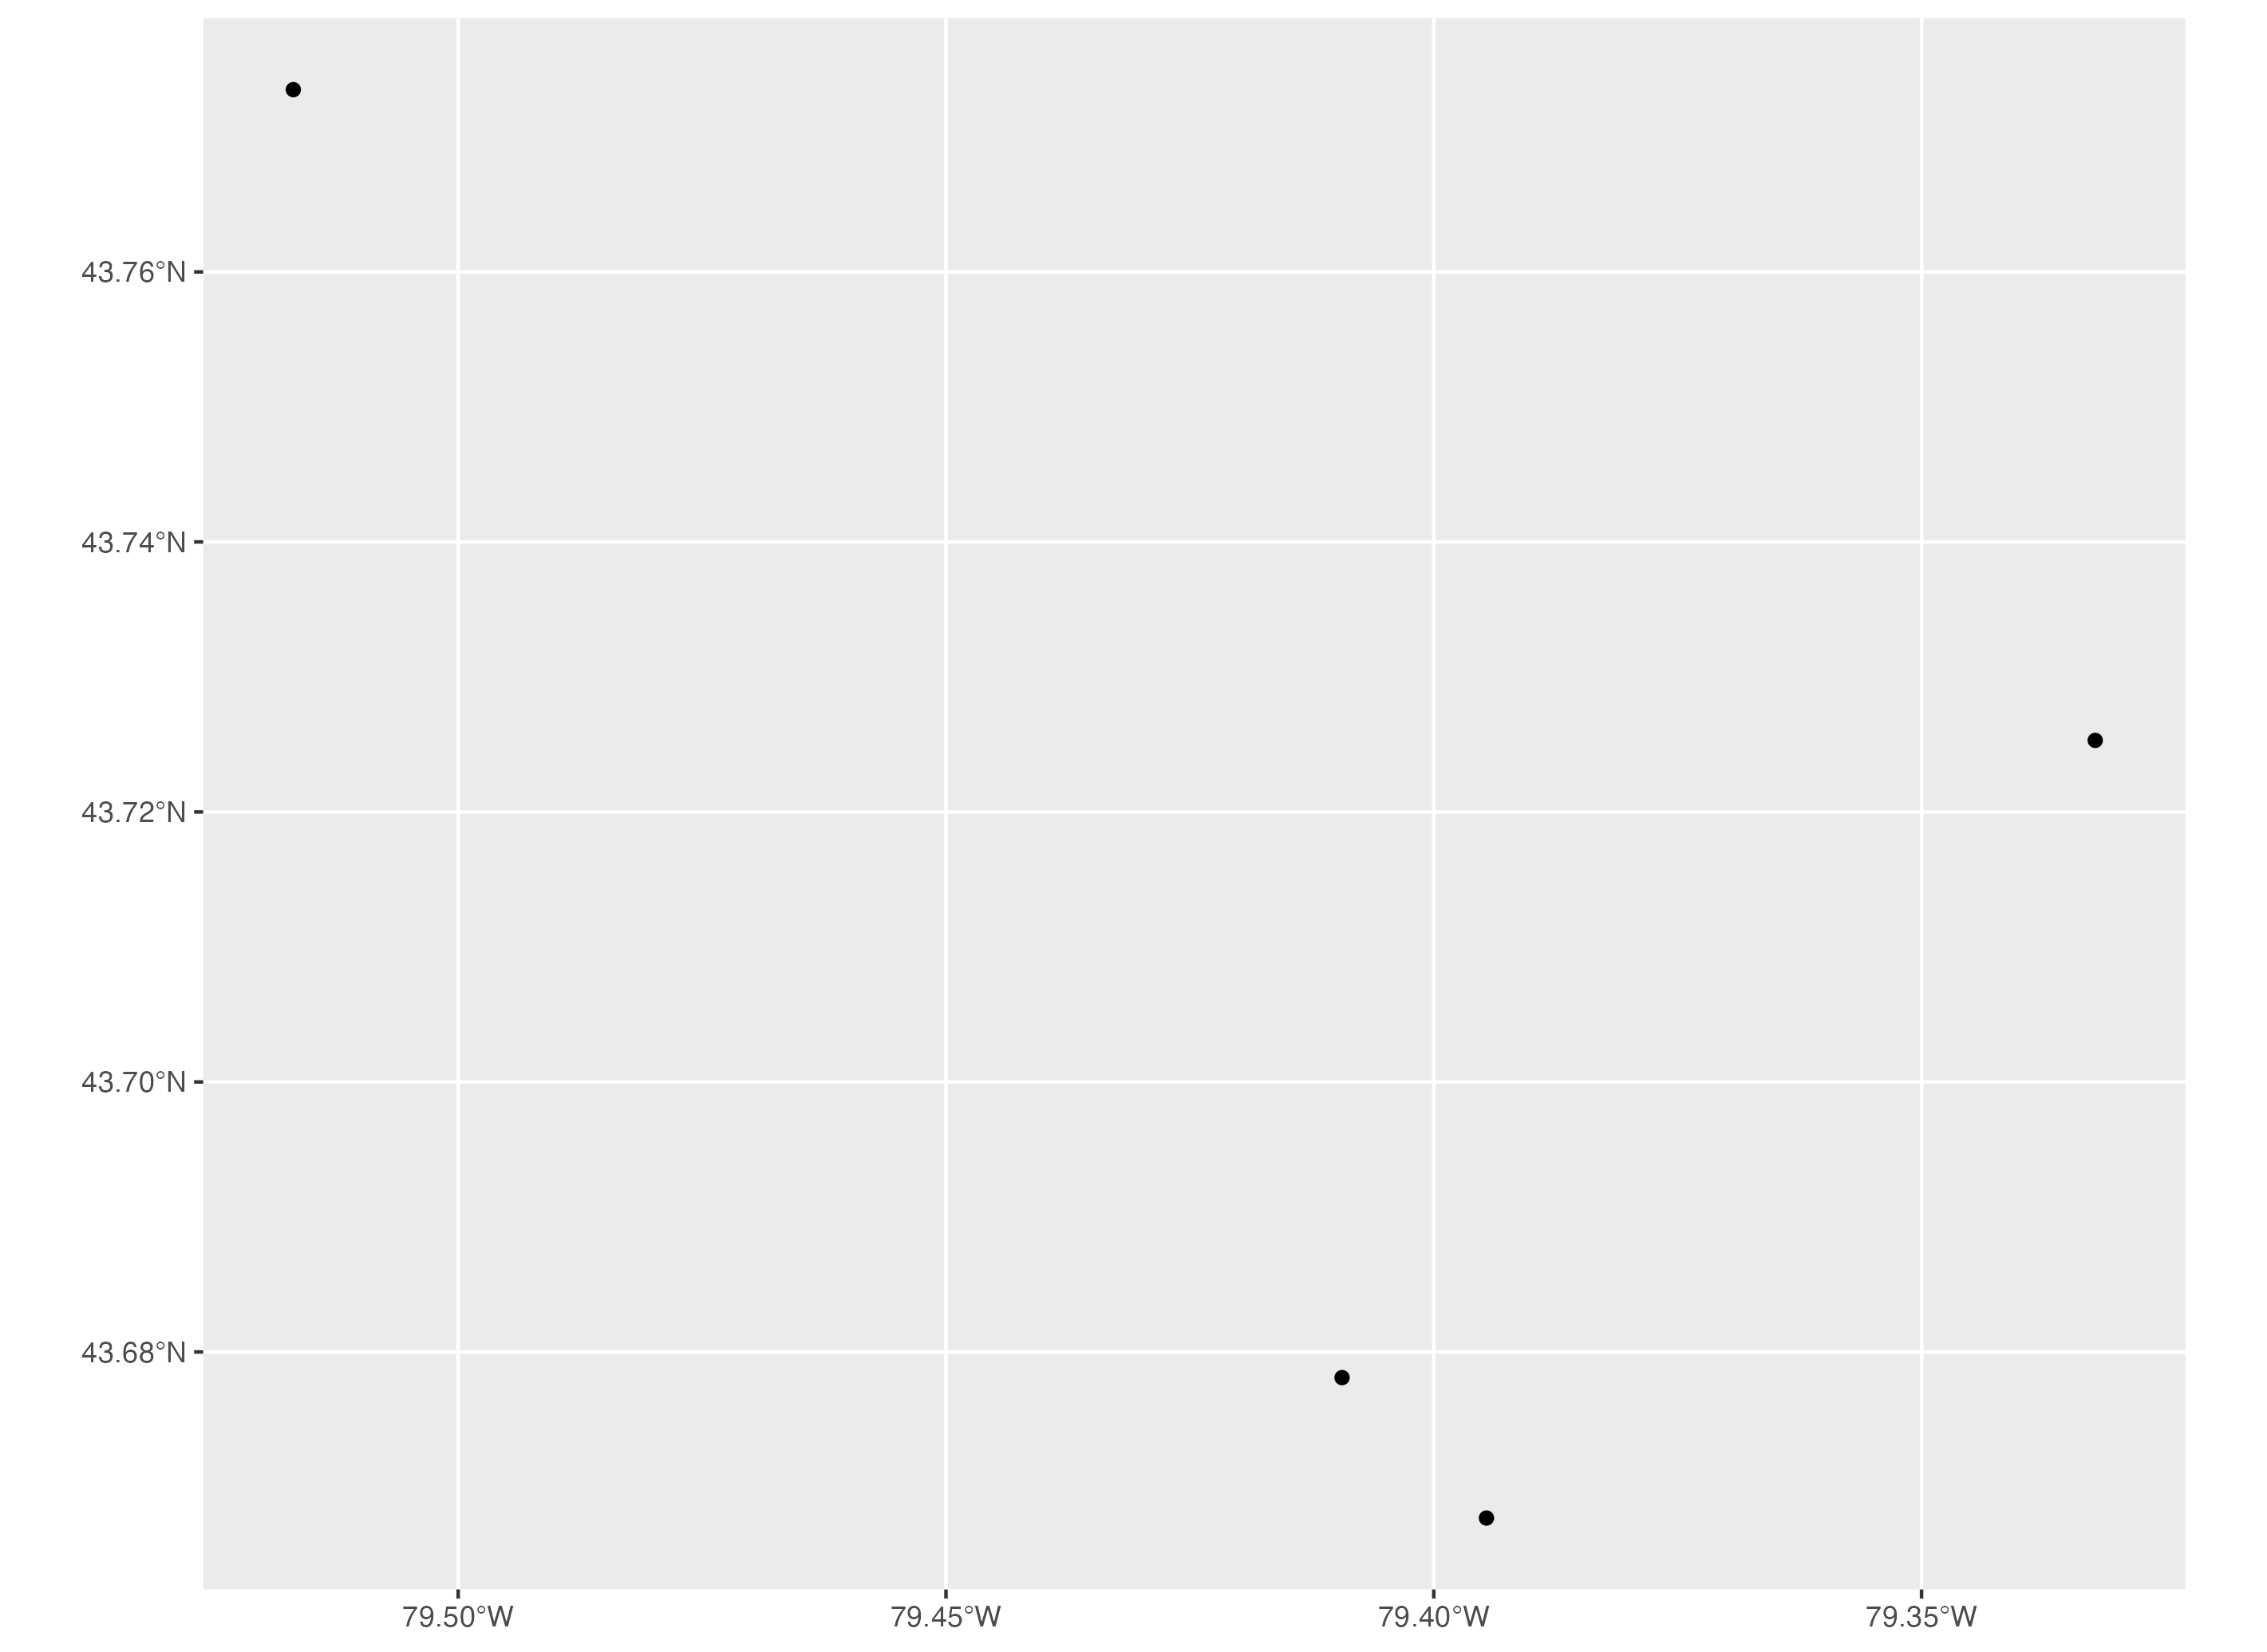
We can make a map of these museums using ggplot2 functions. To make a basic map, we first initialize the plot area using the ggplot() function. Then we use the geom_sf() function to specify the museums spatial dataset. When we run this, it gives us a map of the latitudes and longitudes of the four museums.
# Map museums using ggplot2
ggplot() + geom_sf(data=museums_sf)
Technique: Quantitative Data Analysis, Mapping, Spatial Analysis | Tools: R | Data Format: Microdata