6. Choropleth Map using ggplot2
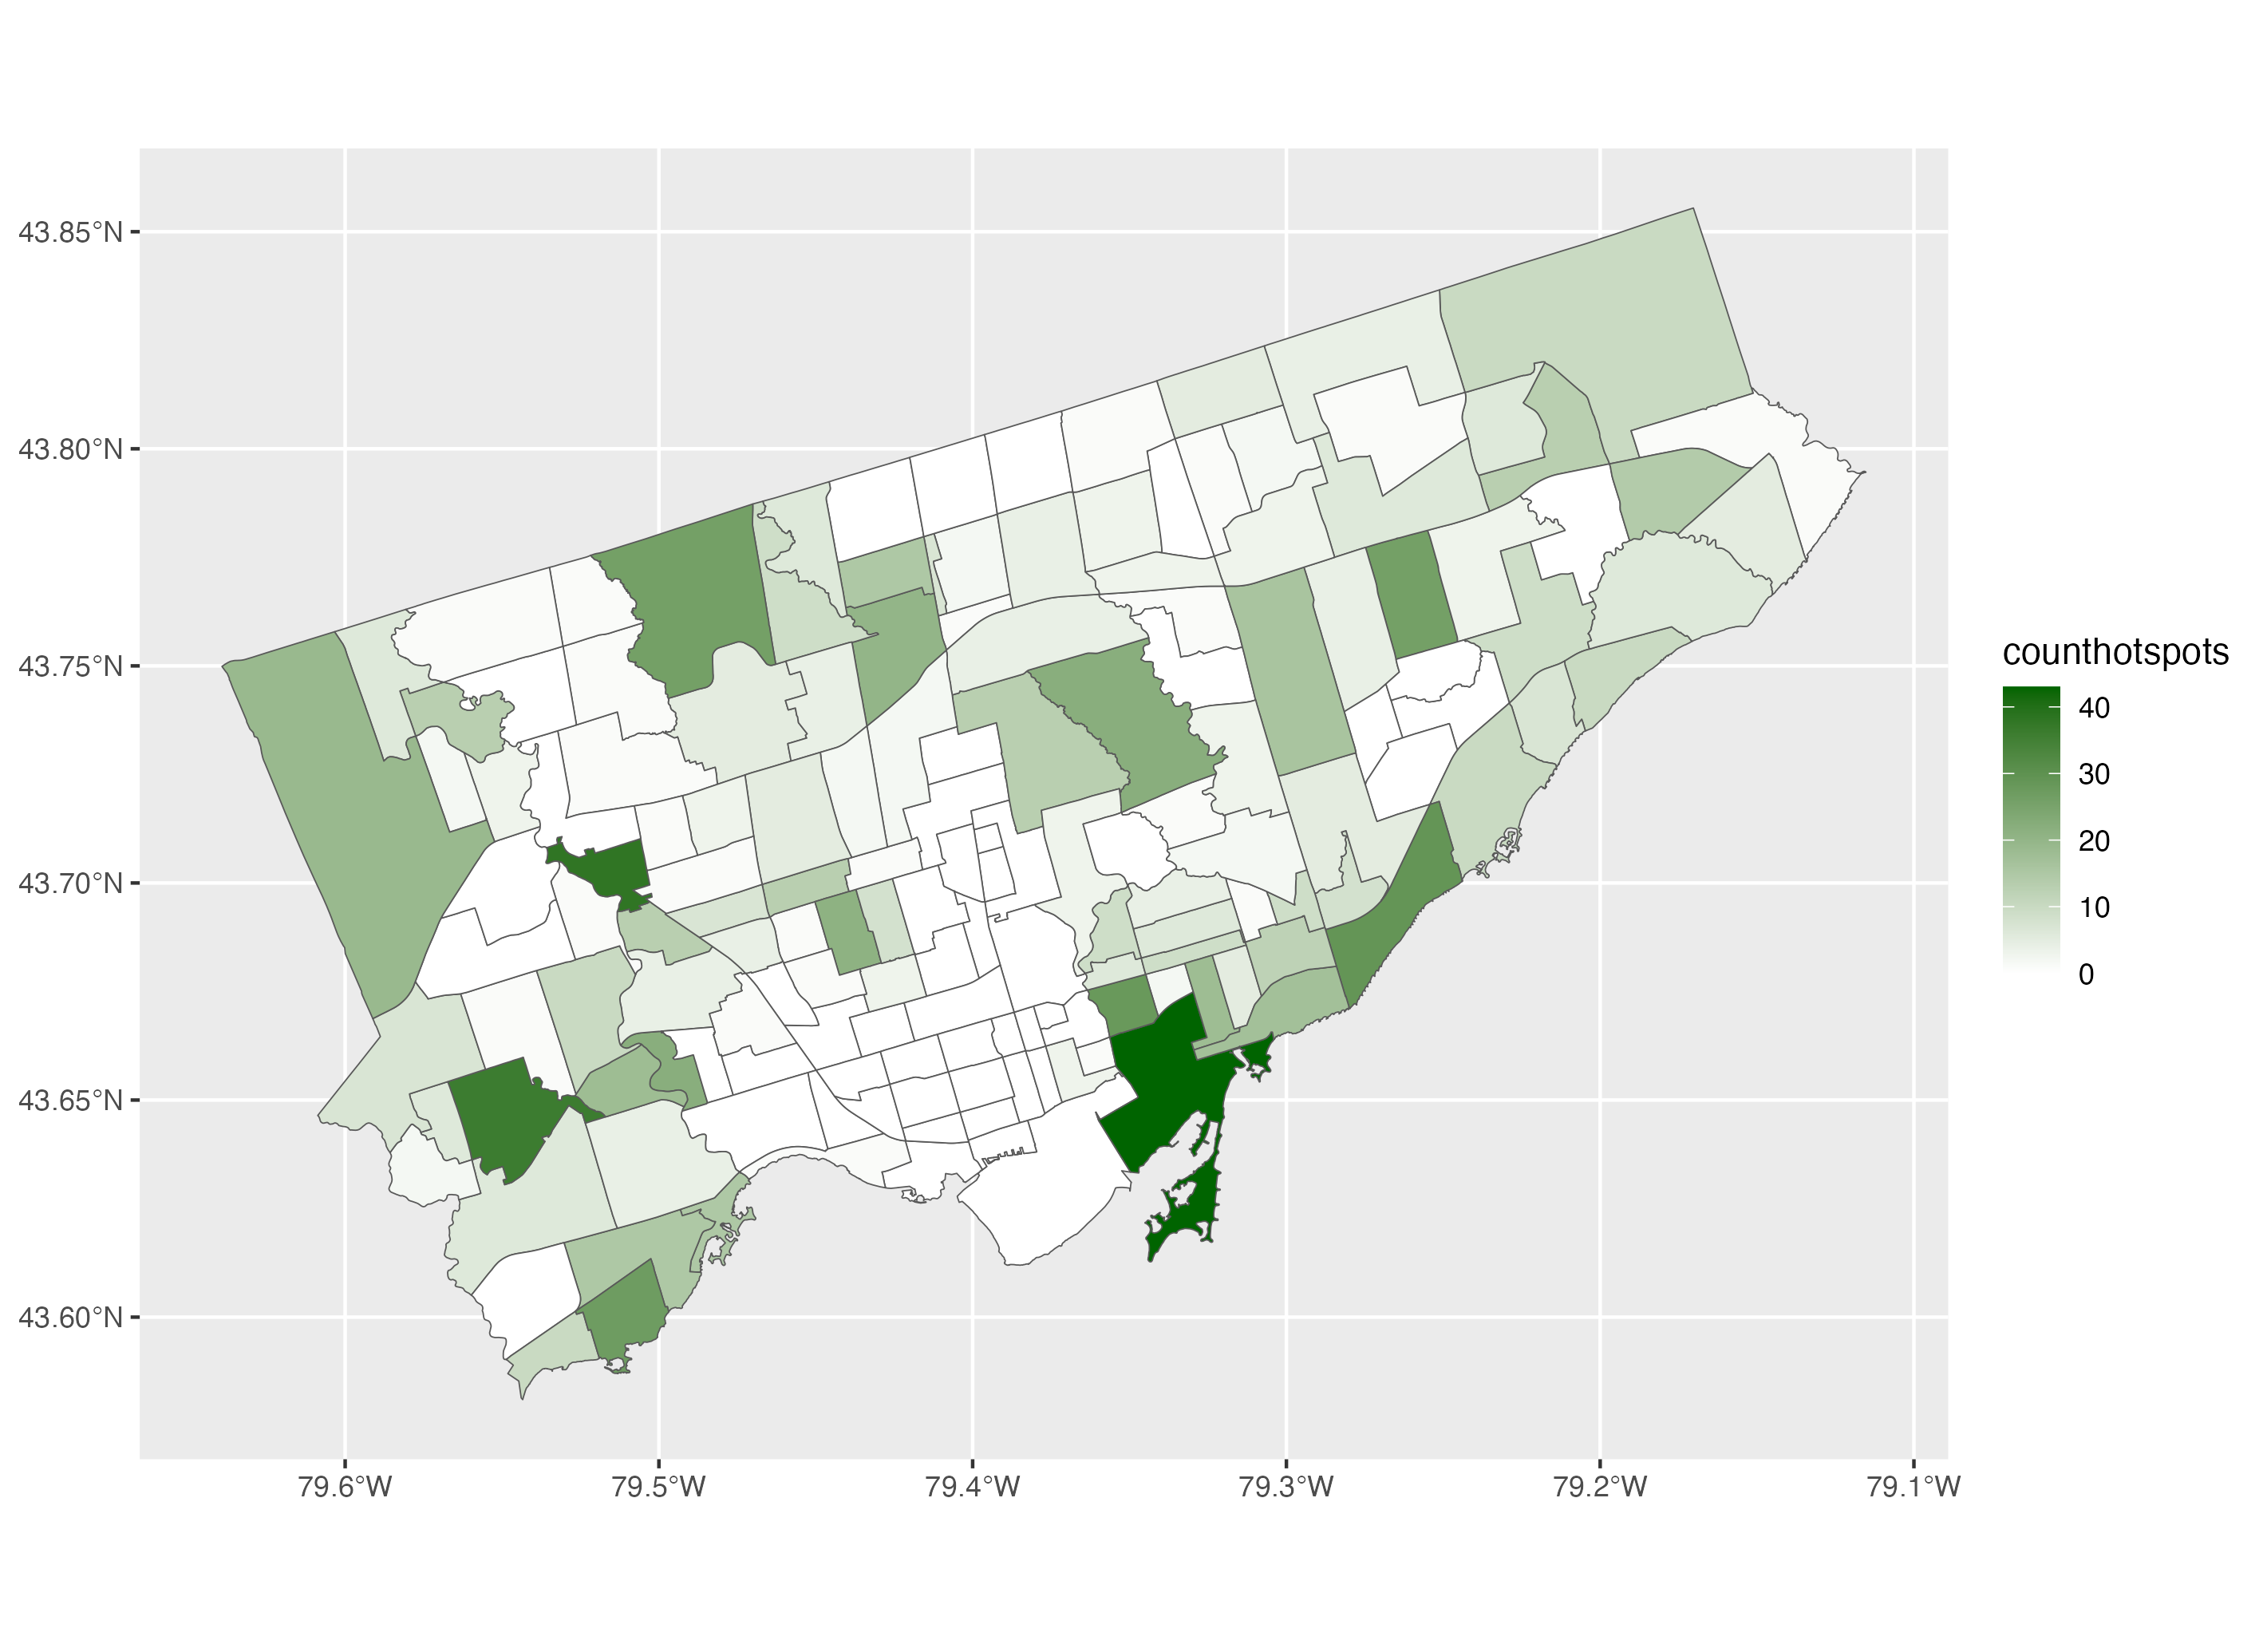
In this section, we will cover how to make choropleth maps using ggplot2. Using the Toronto neighbourhoods dataset we worked on in section 5, we will make a choropleth map of the number of cultural hot spots per neighbourhood. We will make one choropleth using default R colours and a second one using colours from the R ColorBrewer palette.
To make a choropleth map using ggplot2, we use the geom_sf() function with a polygon dataset such as neighbourhoods_sf and we add the variable that we want to use for the choropleth next to the fill argument inside the aes() function. This will create a gradient of colours for the variable of interest: number of hot spots per neighbourhood.
To specify the colour we want to use for the choropleth, we can use the scale_fill_gradient() function. Using the low and high arguments, we specify the two extremes of the colour gradient. In this example, we use white and dark green so the colour gradient varies from white for neighbourhoods with few hot spots to dark green for neighbourhoods with a high number of hot spots.
# 6. Choropleth Map using ggplot2
# Example 1: Basic choropleth using default colours
ggplot() +
  geom_sf(data=neighbourhoods_sf, aes(fill=counthotspots)) +
  scale_fill_gradient(low="white", high="darkgreen")
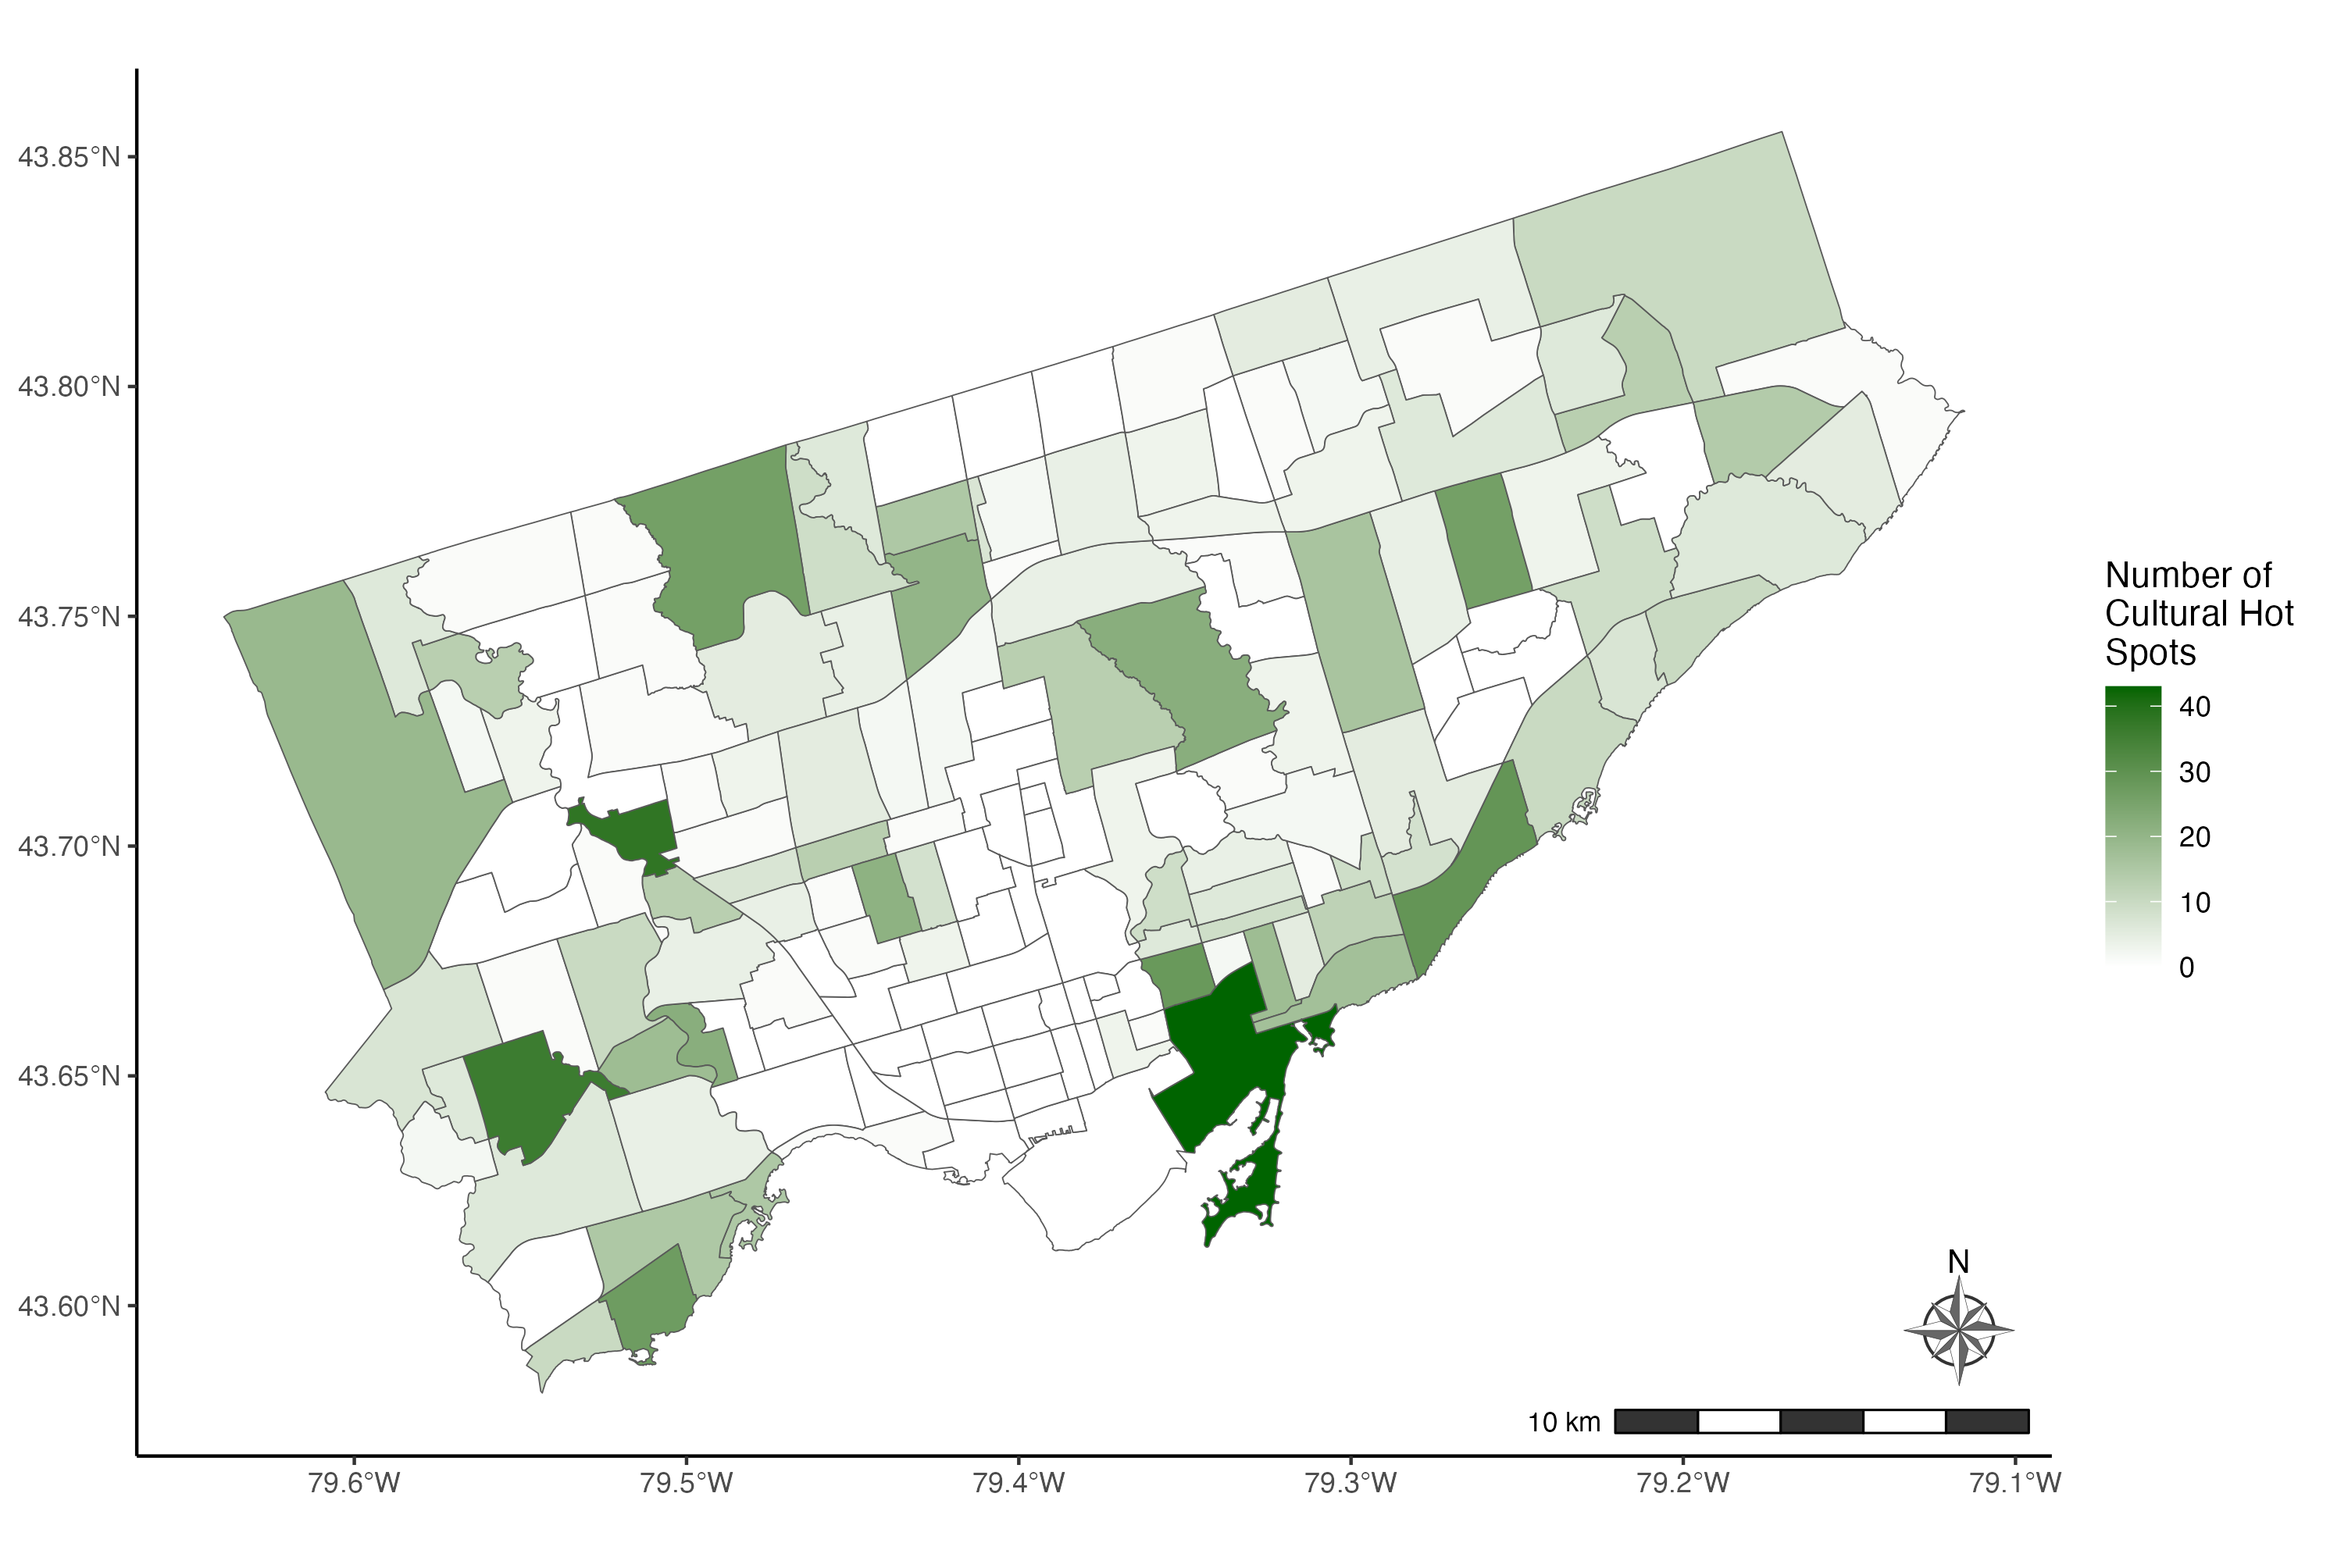
To improve this map further, we apply the classic theme using the theme_classic() function. Then we modify the label of the legend using the fill argument inside the labs() function. And we add the title “Number of Cultural Hot Spots”. We use “\n” inside the legend title to break it up into multiple lines.
To add a scale, we use the annotation_scale() function. We want the scale to be in the bottom right corner of the map so we assign the location argument the value “br”. Then we use the bar_cols argument to select the alternating colours of the scale. We use the R colours grey20 (a dark grey) and white.
To add a north arrow, we use the annotation_north_arrow() function. Using the location argument, we place the north arrow in the bottom right corner of the map. To point the arrow to the true north, we set the argument which_north to “true”. The pad_x and the pad_y arguments are used to specify the distance of the arrow from the edge of the frame. We specify the distances from the edge in units of inches here but you can also use centimetres for example.
Finally, the style argument is used to specify the drawing style of the arrow. You will find the full selection of north arrow drawings here. We are using the north_arrow_nautical() style here. For this specific style, we select the alternating colours used to fill the arrow using the fill argument and the colour of the border of the arrow using the line_col argument.
# Example 1: Complete choropleth using default colours
ggplot() +
  geom_sf(data=neighbourhoods_sf, aes(fill=counthotspots)) +
  scale_fill_gradient(low="white", high="darkgreen") +
  theme_classic() +
  labs(fill= "Number of\nCultural Hot\nSpots") +
  annotation_scale(location = "br", bar_cols = c("grey20", "white")) +
  annotation_north_arrow(location = "br", which_north = "true",
                         pad_x = unit(0.1, "in"), pad_y = unit(0.3, "in"),
                         style = north_arrow_nautical(fill = c("grey40", "white"),
 line_col = "grey20"))
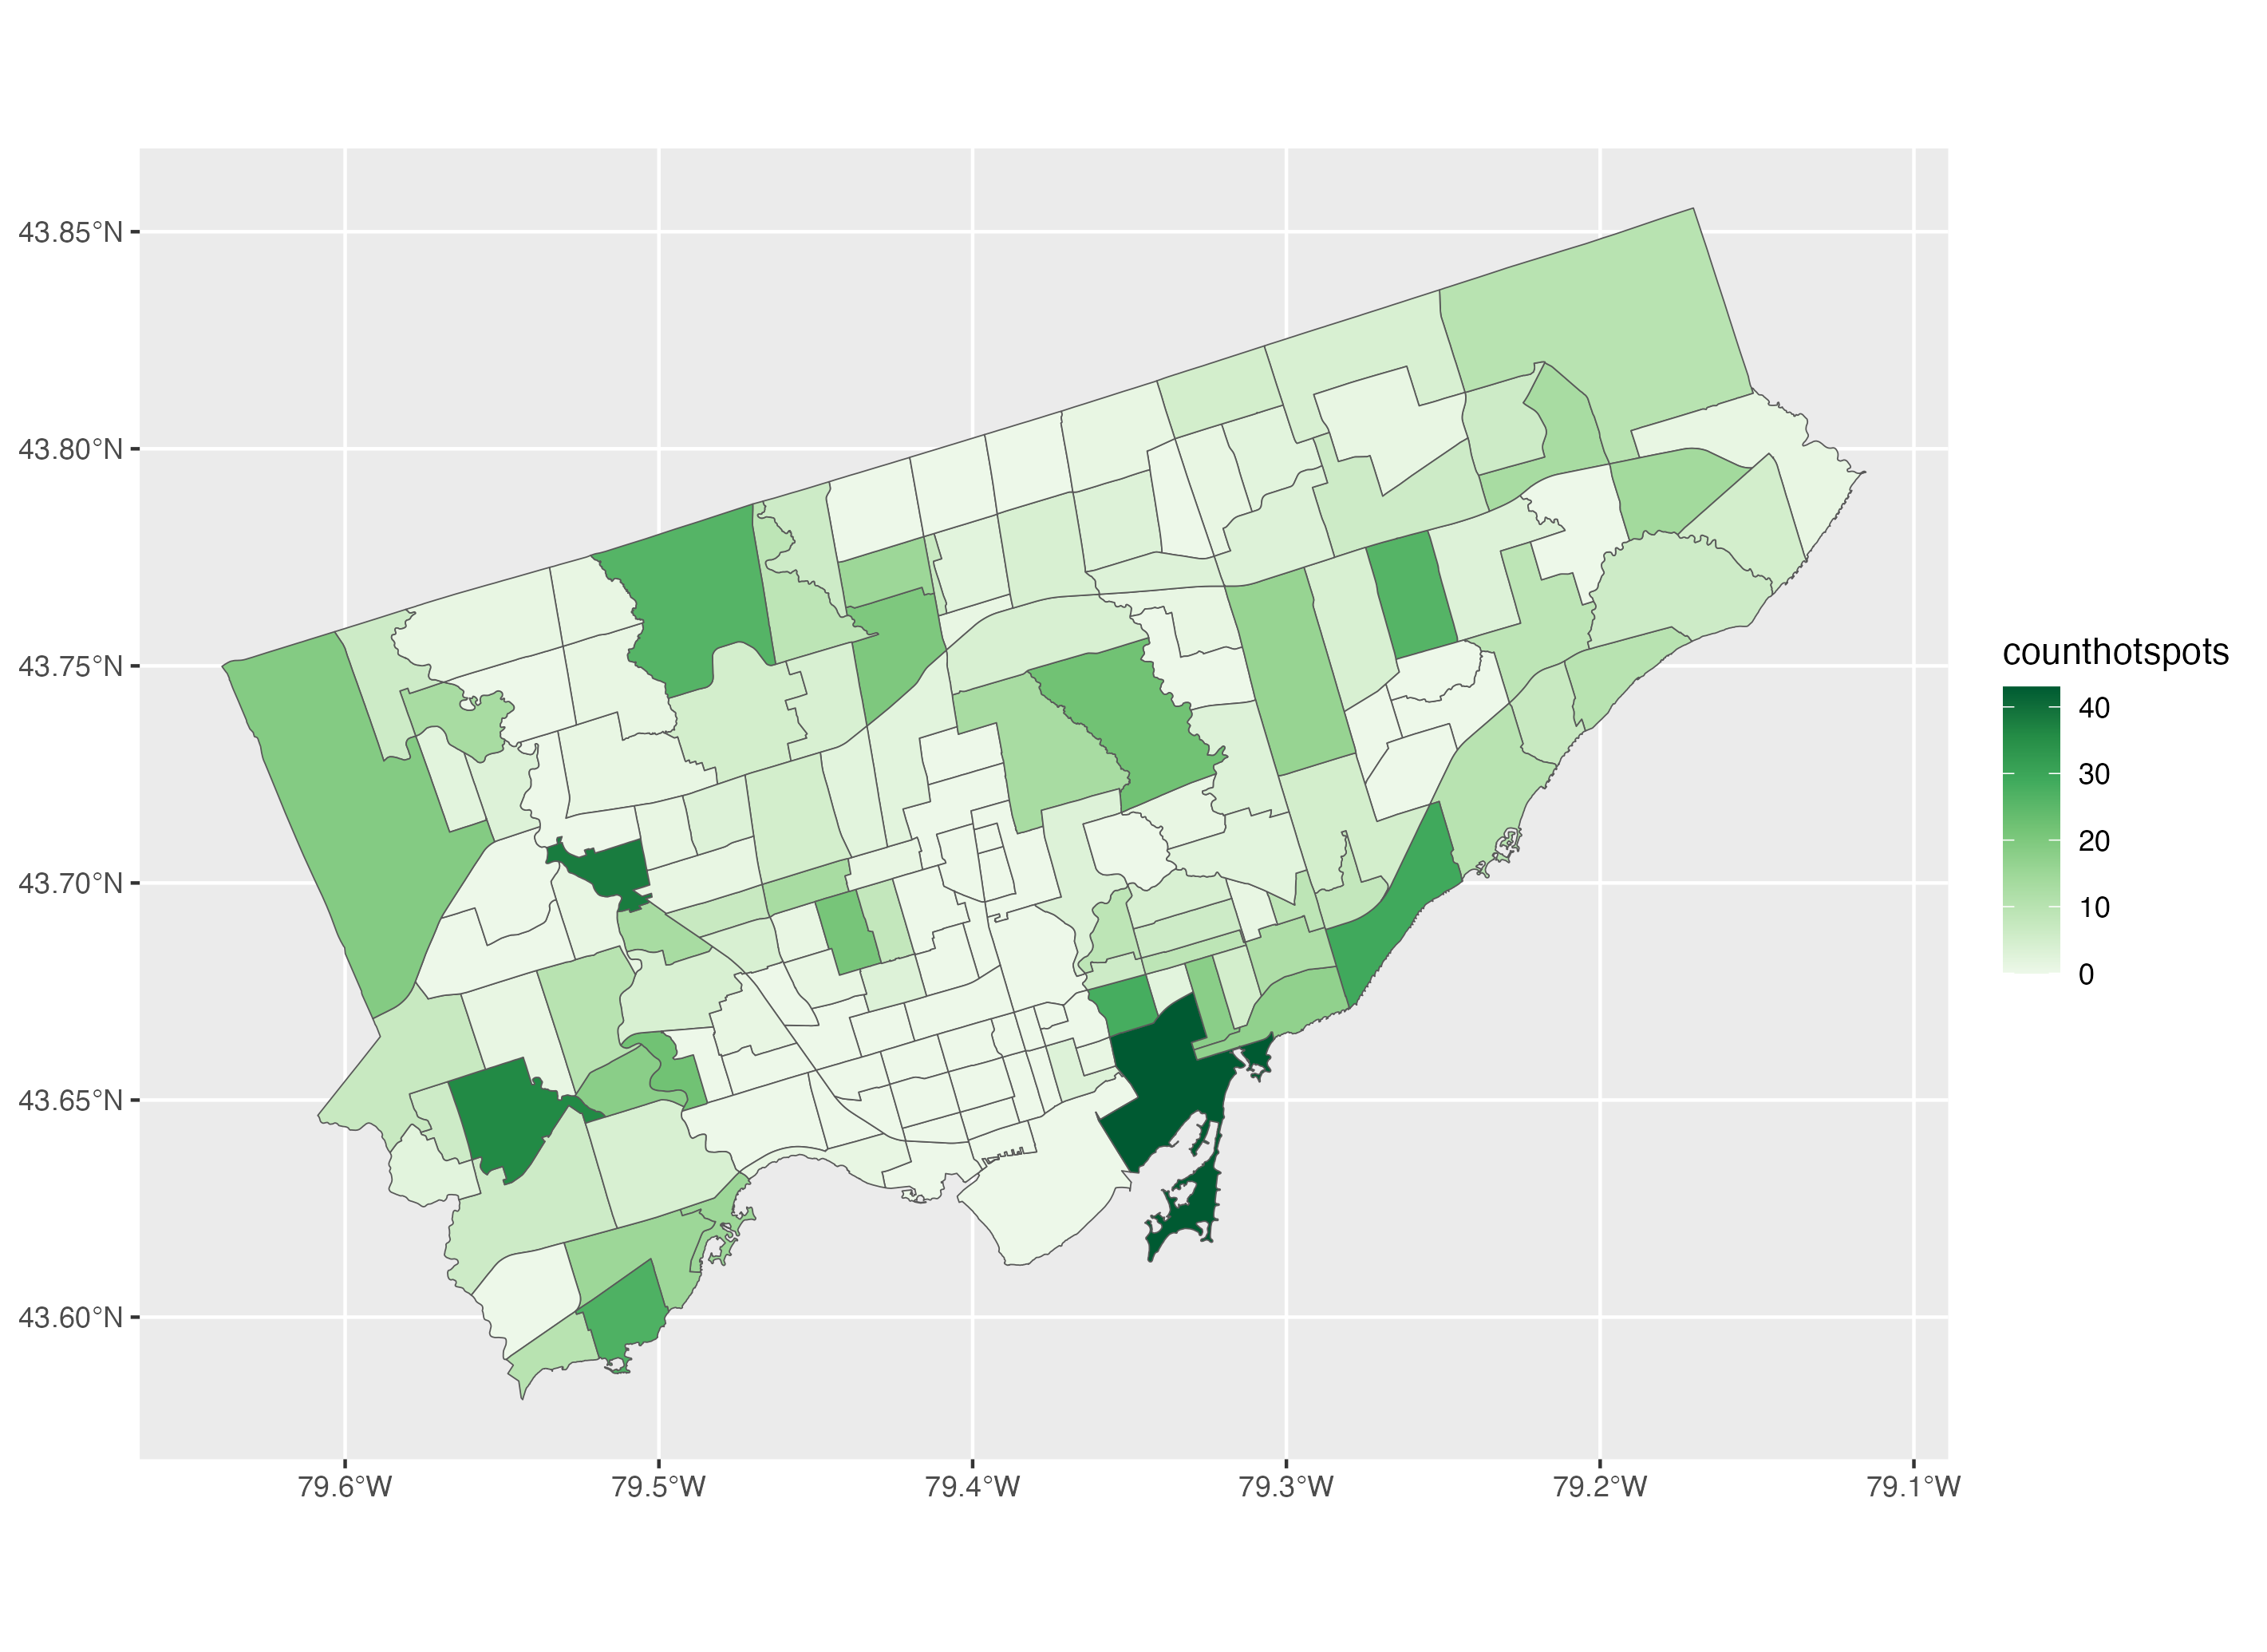
In the second example, we are going to make the same map using colours from the R ColorBrewer palette. Similar to example 1, we start by adding the dataset neighbourhoods_sf in the geom_sf() function and we add the variable of interest, number of cultural hot spots next to the fill argument.
Then to choose the colours of the choropleth, we use the scale_fill_distiller() function. We choose the colour palette using the palette argument. Then to apply light green colours to neighbourhoods with a low number of cultural hot spots and dark green colours to neighbourhoods with a high number of cultural hot spots, we set the direction argument to 1. This reverses the default colour gradient direction of dark green for low values and light green for high values.
# Example 2: Basic choropleth using the ColorBrewer palette
ggplot() +
  geom_sf(data=neighbourhoods_sf, aes(fill=counthotspots)) +
 scale_fill_distiller(palette="Greens", direction=1)
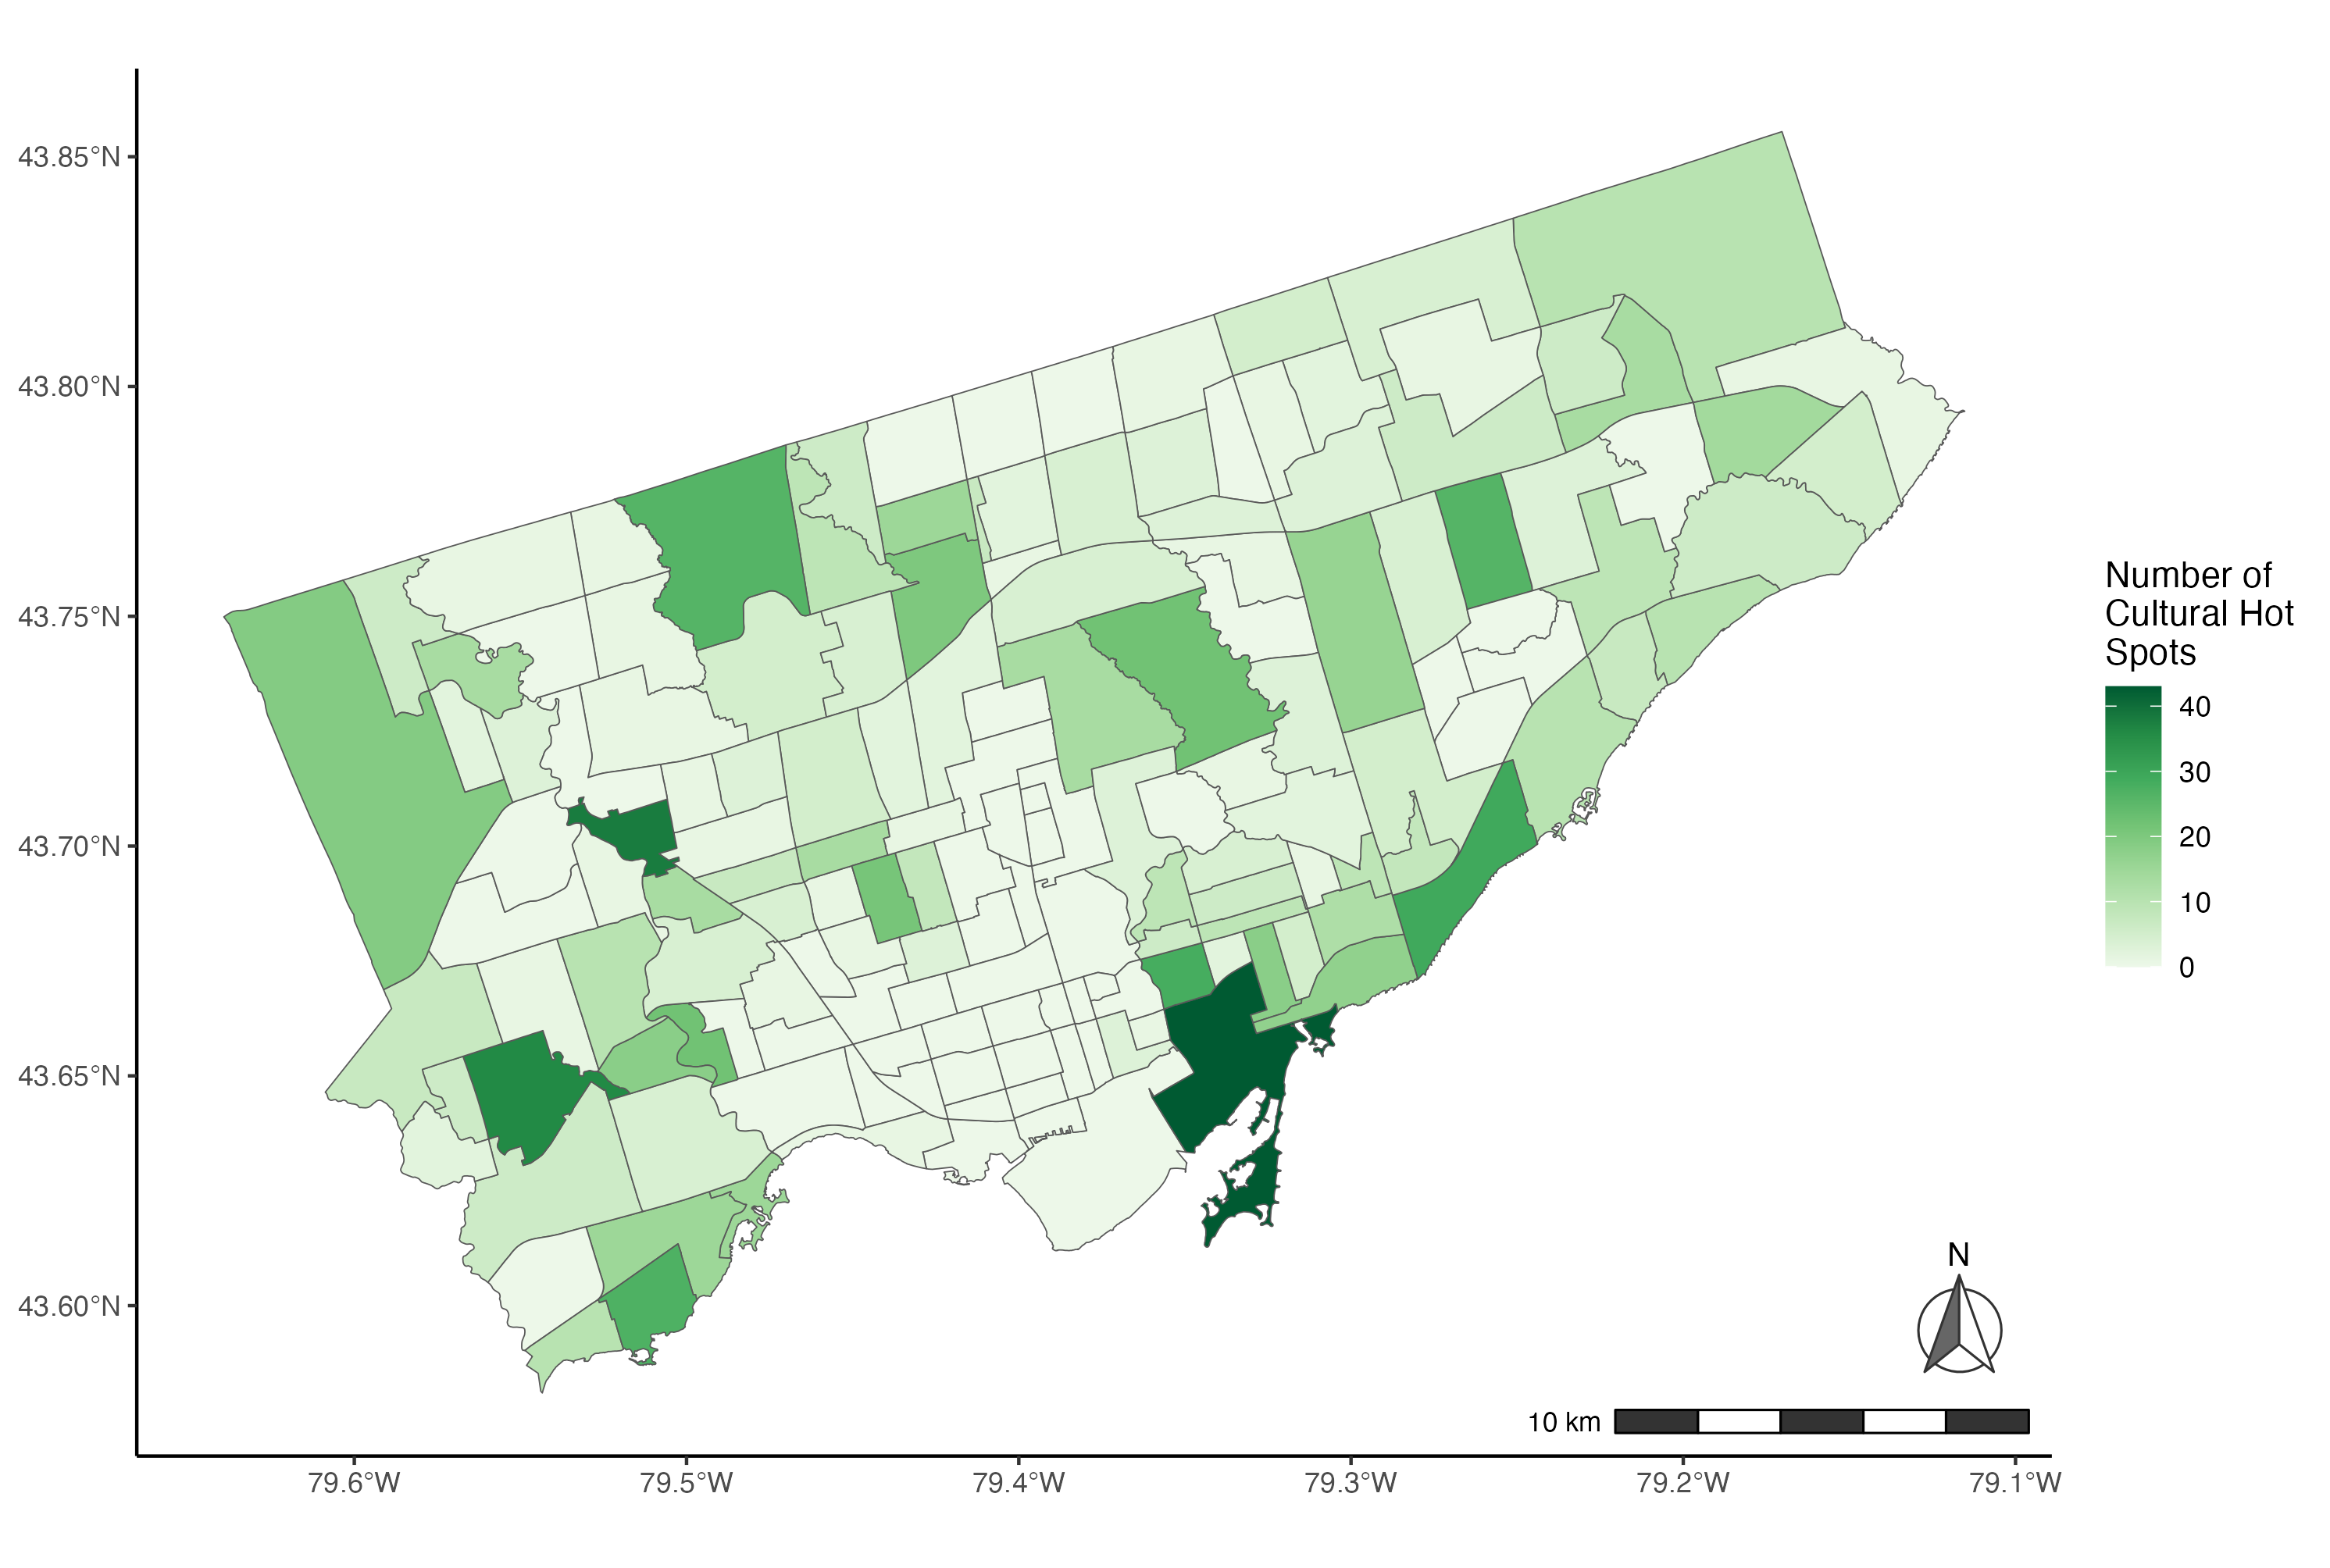
Then we improve this choropleth map by applying a theme, adding a legend title, adding a scale, and a north arrow similar to what we did in the first example.
# Example 2: Complete choropleth using the ColorBrewer palette
ggplot() +
  geom_sf(data=neighbourhoods_sf, aes(fill=counthotspots)) +
 scale_fill_distiller(palette="Greens", direction=1) +
  theme_classic() +
  labs(fill="Number of\nCultural Hot\nSpots") +
  annotation_scale(location = "br", bar_cols = c("grey20", "white")) +
  annotation_north_arrow(location = "br", which_north = "true",
                         pad_x = unit(0.1, "in"), pad_y = unit(0.3, "in"),
                         style = north_arrow_nautical(fill = c("grey40", "white"),
 line_col = "grey20"))
Technique: Quantitative Data Analysis, Mapping, Spatial Analysis | Tools: R | Data Format: Microdata