C. Import this data into Gephi
- First, let’s start up Gephi (we can search for it in the Windows Programs menu if we don’t see a desktop shortcut).
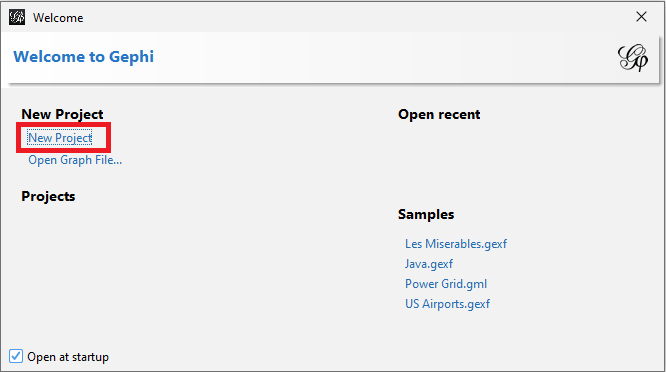
We should see a welcome screen where we can revisit recent projects or look at sample datasets.
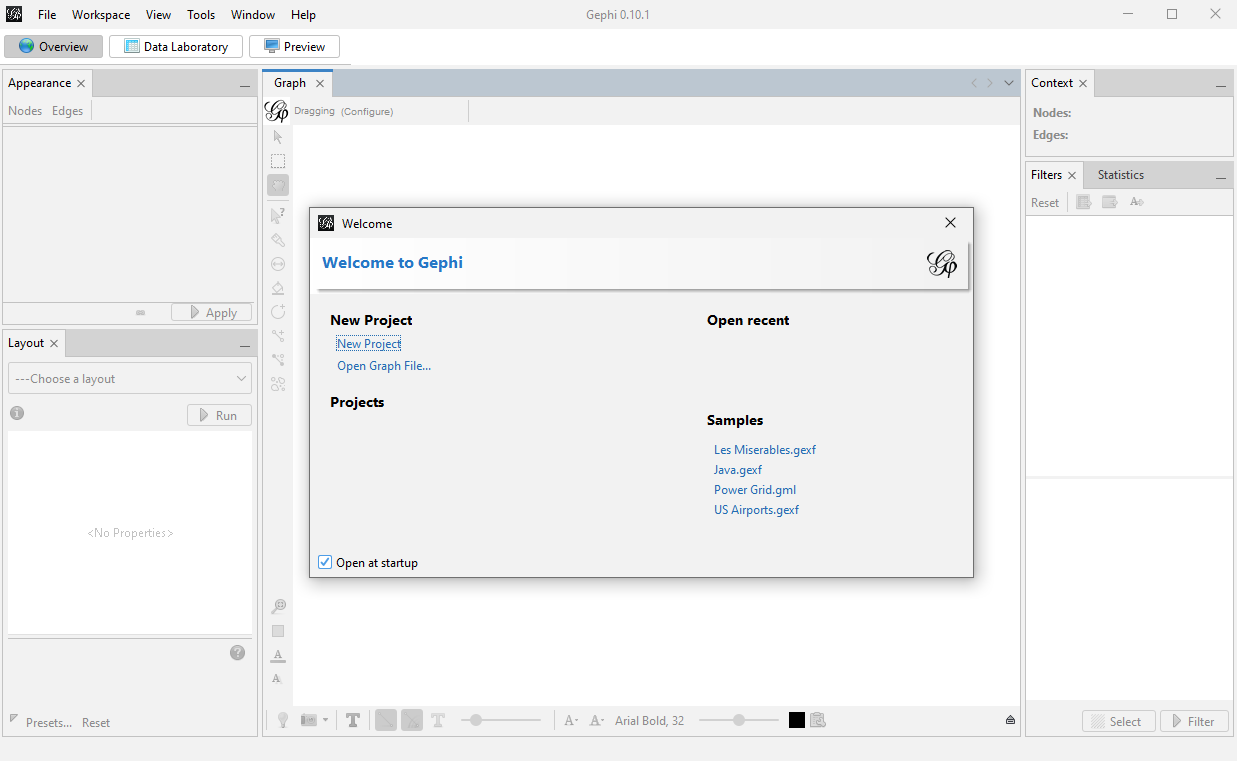
We can also use this screen to open up a graph file, if we had one. In our case, we want to create a new project, so click on New Project from this screen.
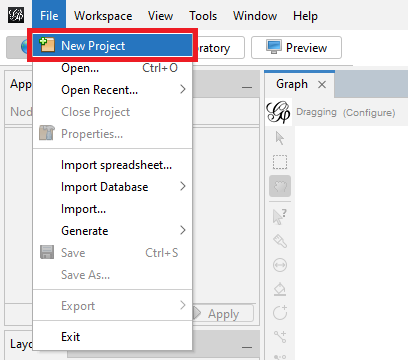
If we had closed this window by mistake, we can also use File->New Project.
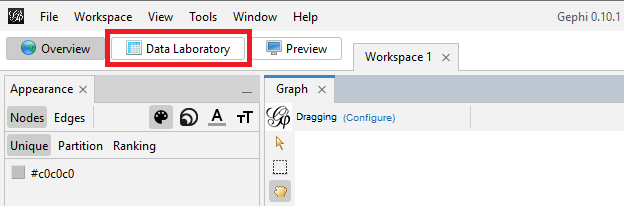
Along the top, we notice there are three tabs – Overview, Data Laboratory, and Preview. Let’s look at the Data Laboratory tab first to load some data.
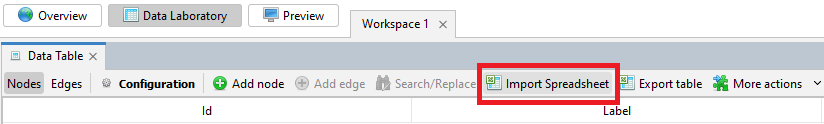
We are going to load the nodes and edges data we have for Romeo and Juliet. Click on the Import Spreadsheet button at the top.
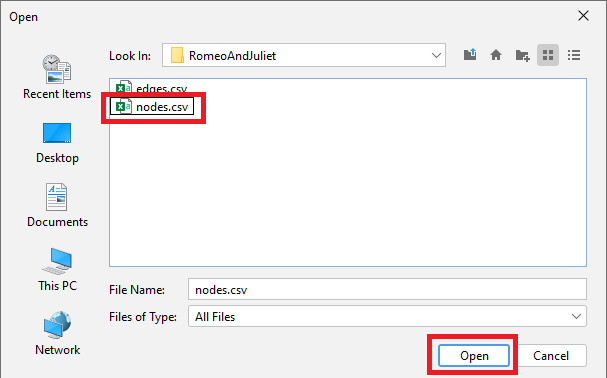
Browse to the downloaded workshop files, into the RomeoAndJuliet folder, open up the nodes.csv, and then click on Open.
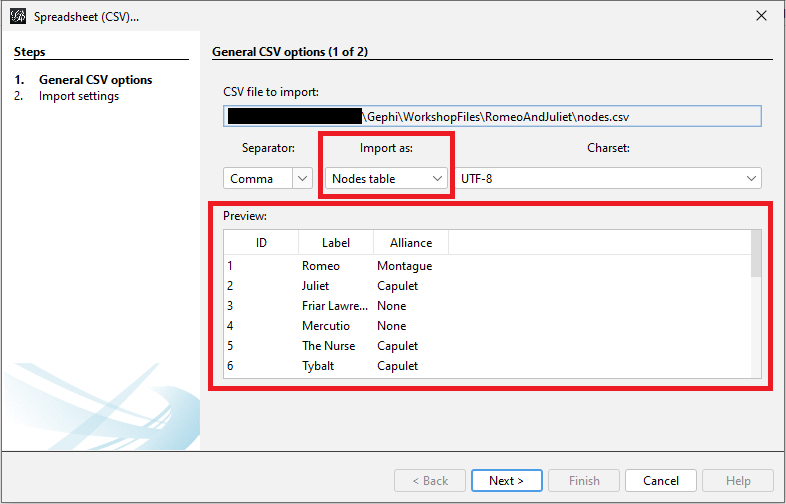
Gephi opens up a wizard to help us load the data. It will show us a preview of the data. We can see that it says it is importing it as a Nodes table.
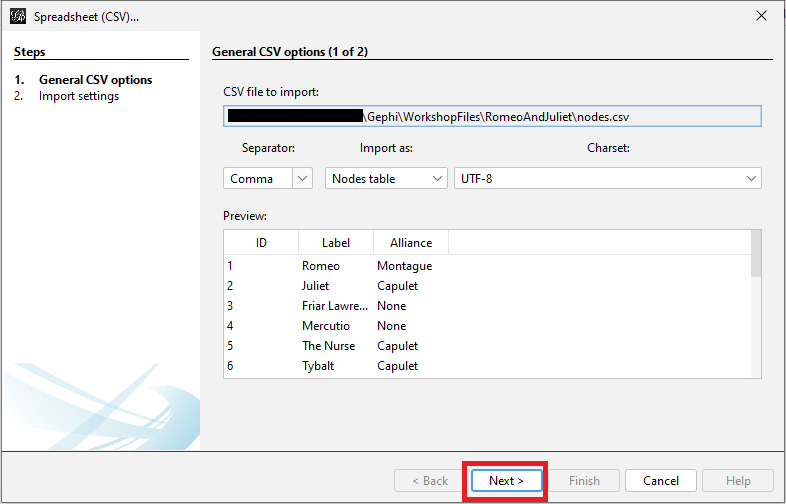
We are happy with these settings so click on Next.
We will see a list of imported columns, and this is where we could change what columns are imported and their type, if it is incorrect. We want Alliance to be a string, so it is fine the way it is – no changes necessary. So click on Finish.

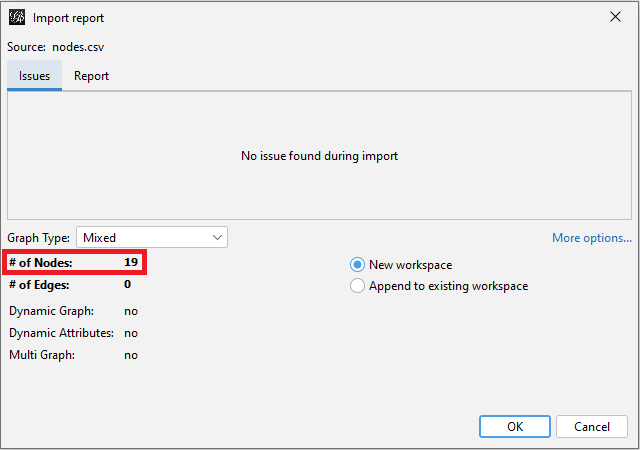
Finally, we will see a pop-up window that tells us if there were any issues with the import. This screen tells us how many nodes are in our graph = 19, which is helpful.
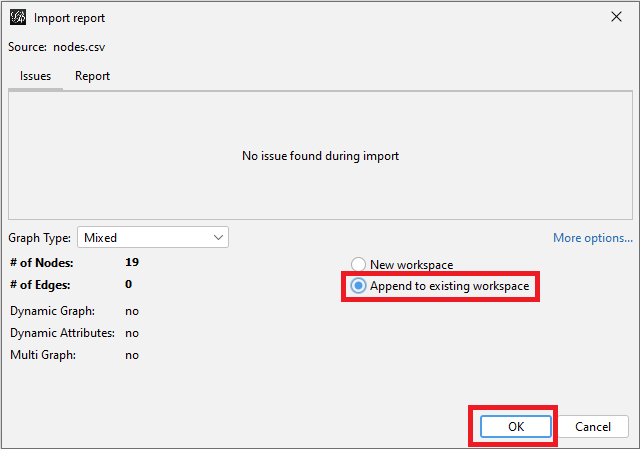
We should select that we want to Append to existing workspace, instead of creating a new workspace, as we already have a new project and workspace open, and then click on OK.
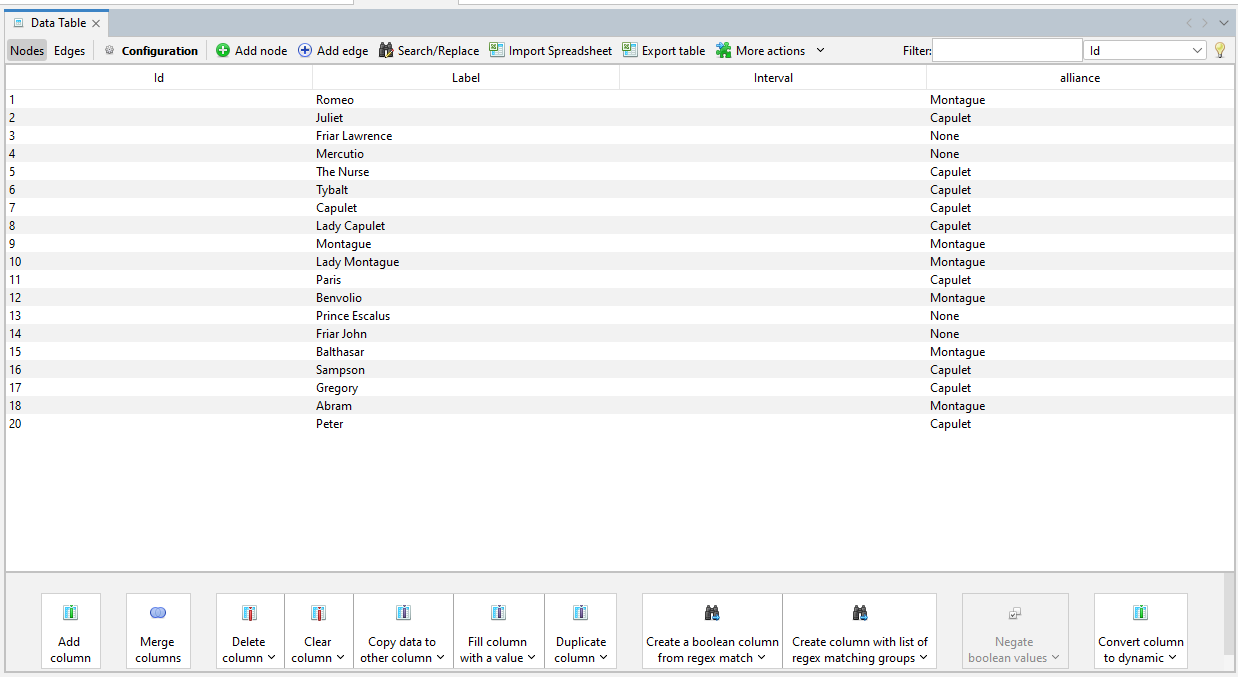
Now we should be able to see a preview of the nodes spreadsheet loaded.
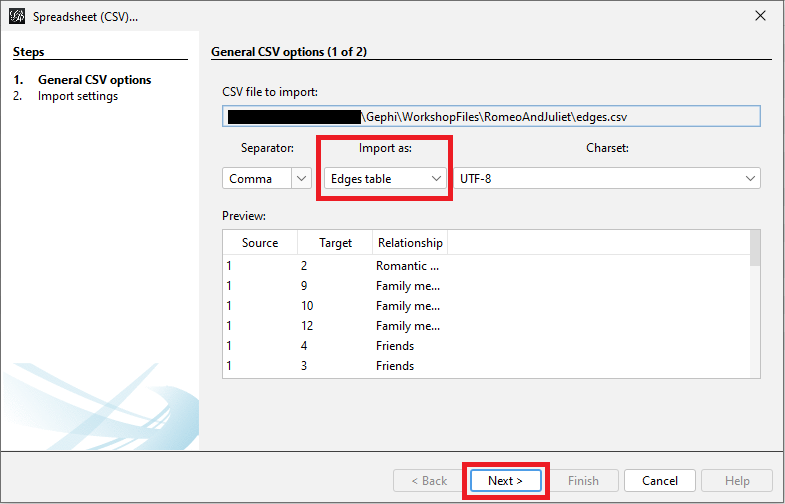
Next, we need to load the edges spreadsheet. Click on import spreadsheet, and select the Edges.csv. Again, Gephi will open up a wizard, showing a preview of the data and indicating that it is says it is importing it as an Edges table. Click on Next.
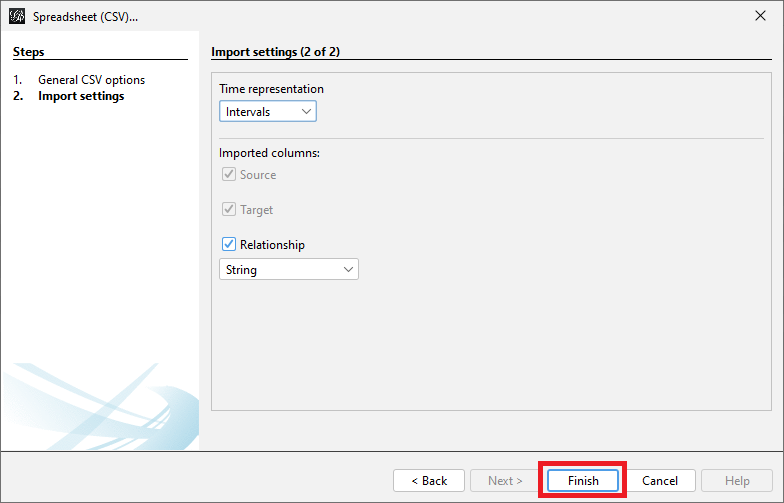
Keep the defaults and click on Finish.
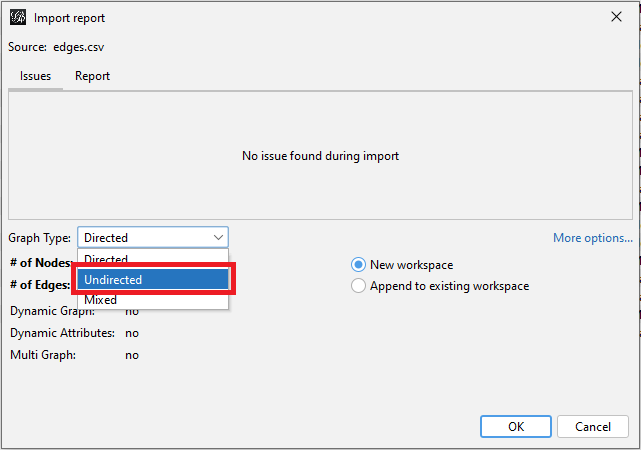
Finally, we will see the window pop-up again to tell us if there are any issues. Here, we should specify that the Graph Type is Undirected for our edges (i.e., the relationship is mutual).
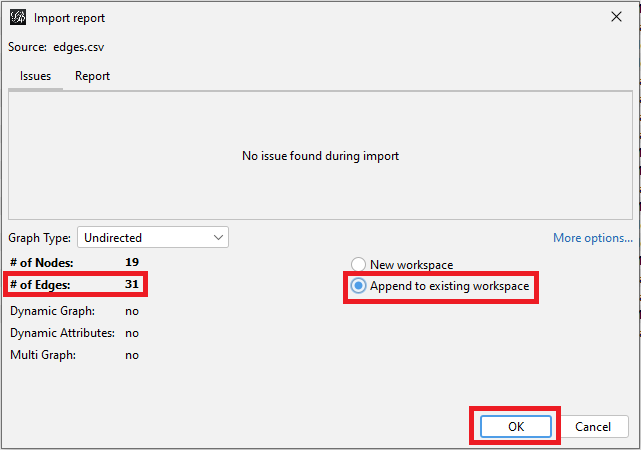
We also see that we have 31 edges in our graph. Again, we want to select Append to existing workspace, and then click on OK. Upon clicking OK, a new window will show up stating that there were 0 mutual edges removed to fulfil the undirected type - disregard this by clicking Close. Now, the edges spreadsheet has been loaded.
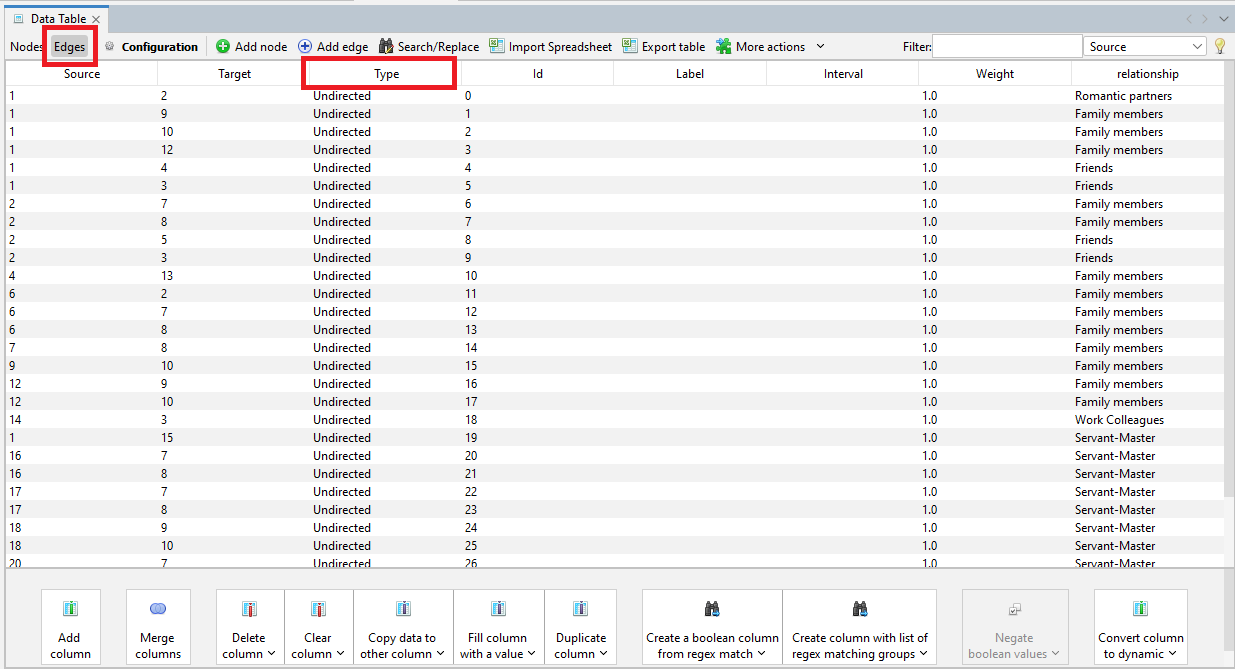
We can toggle between the different tables using the Nodes and Edges buttons on the top left.
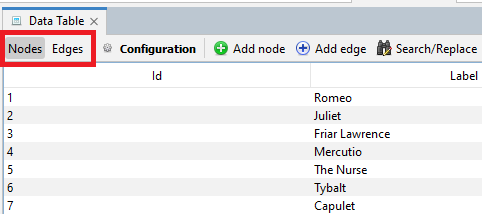
If we toggle to show the edges table, we will see some extra columns have been added to specify the type of edge, in our case, undirected. There are also extra columns; for example, label, which we could have used for edge labels.
Now our network data is loaded, and ready to visualize and analyze.
Technique: Data Visualization | Tools: Gephi