H. Export visualizations as interactive web pages
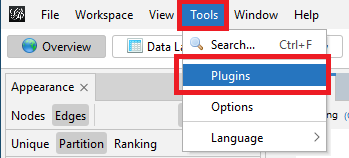
Gephi can also create an interactive HTML web page (that can be hosted on a web server) using the SigmaExporter Plugin. To do so, first ensure that the plugin has been installed and is active. From the top menu, select Tools and then select Plugins.
Click on the Installed tab and ensure that SigmaExporter is listed.
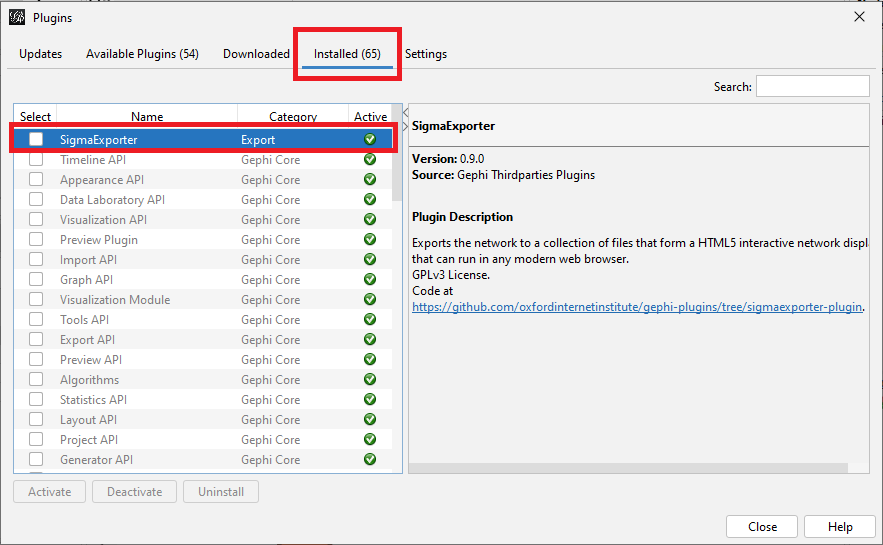
If you are missing the Plugin, you can download it here from Gephi’s website. For further guidance on this step, refer to section A of this tutorial.
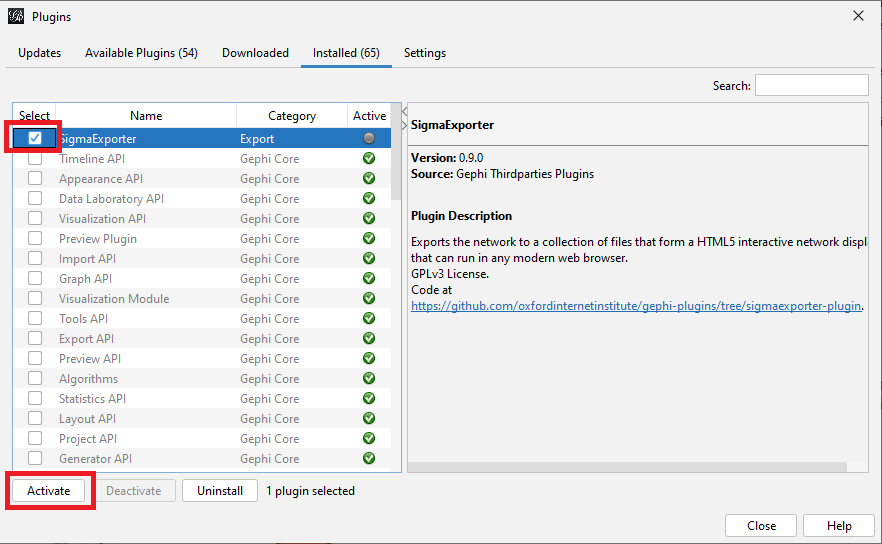
In the same Plugins window, now make sure that SigmaExporter is also active. Click on the Installed tab and check that a green checkmark appears in the Active column for SigmaExporter. If it doesn’t, check the box next to SigmaExporter and click on the Activate button underneath the list of plugins. Then close the plugins window.
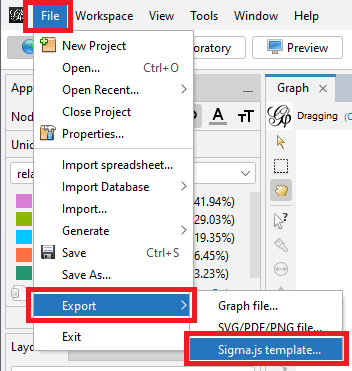
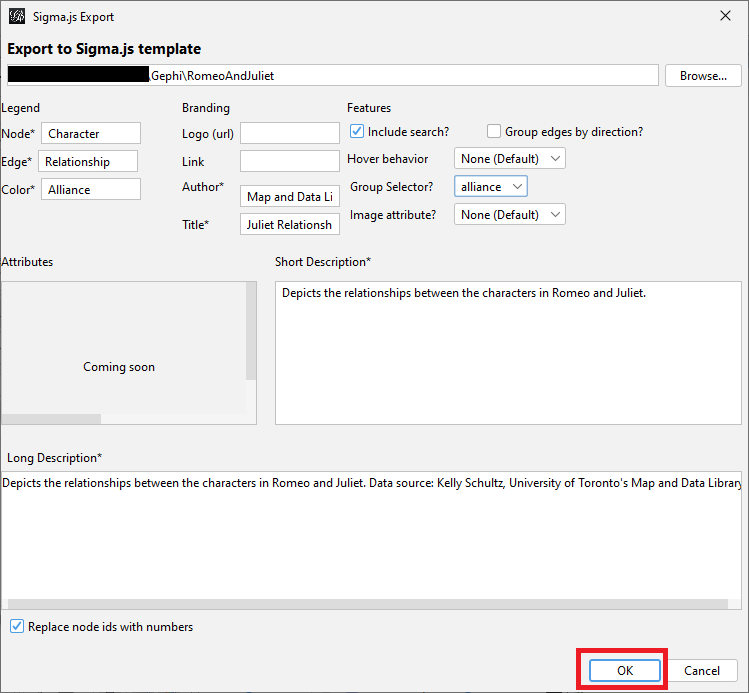
To create an interactive visualization, go to the File menu, select Export and select Sigma.js template…
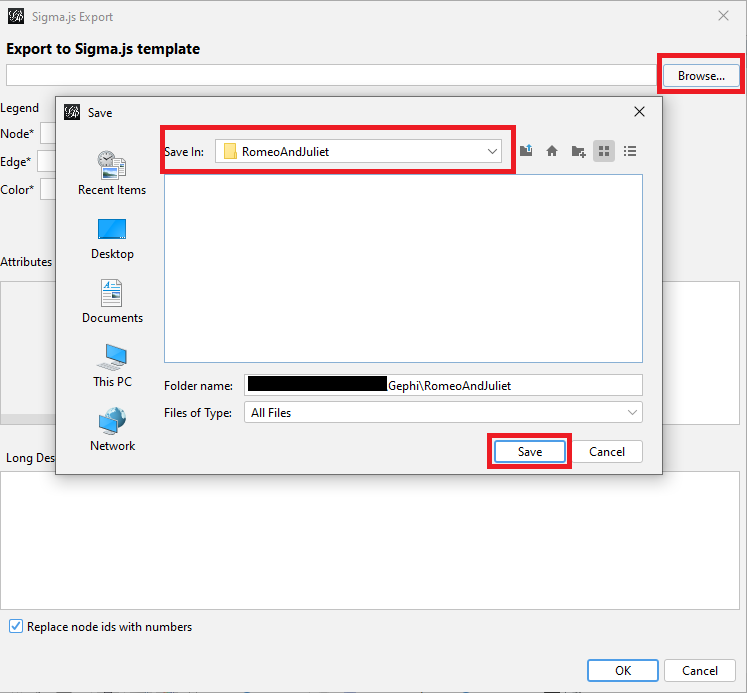
Click on the Browse button at the top and navigate to where you want to save the website, in our case, the RomeoAndJuliet folder.
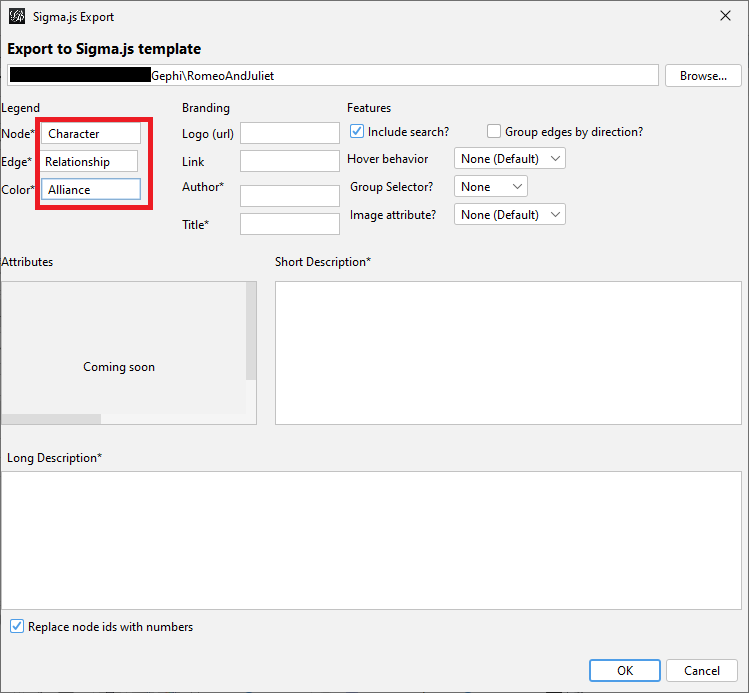
For the Legend you can specify what the nodes, edges, and colours represent. In our case, write “Character” for Node, “Relationship” for Edge and “Alliance” for Colour.
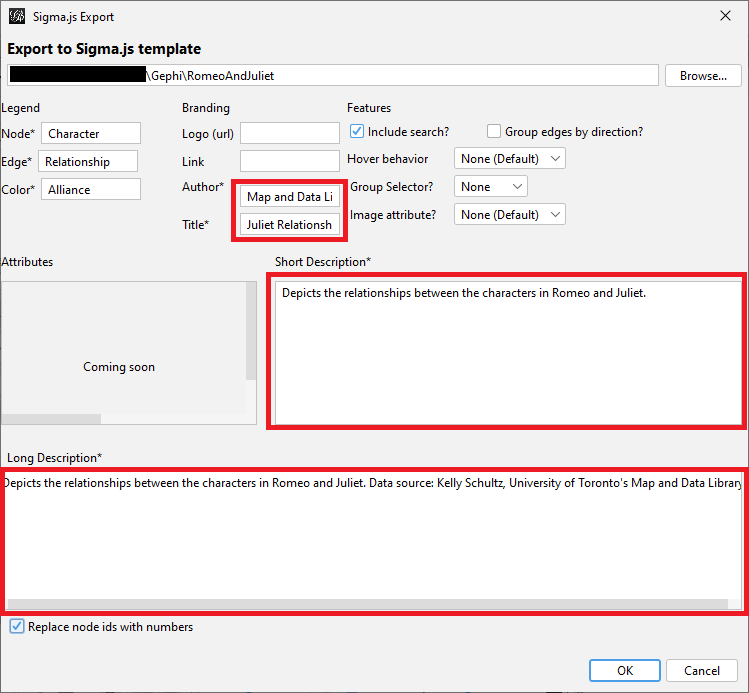
Fill in information for the Author, Title, Short Description and Long Description fields.
Select alliance from the Group Selector menu so that we can select nodes by alliance.
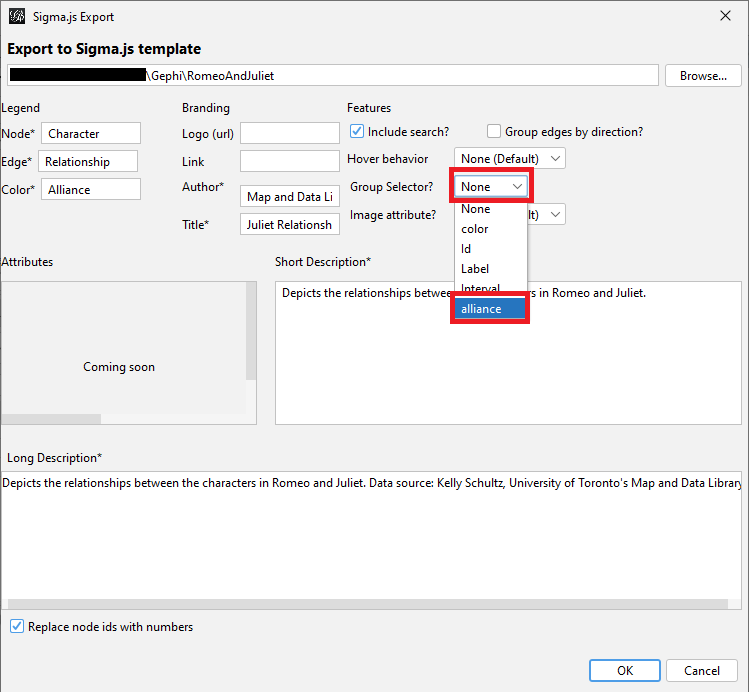
Keep all the other defaults for now and click OK.
Open Windows File Explorer and navigate to the folder you just saved to. Within it, open the newly created network folder that contains the interactive web page. You would put these files on a web server to share them online with others. See the section below called Viewing Exported Webpage if you want to view and interact with the finished product locally first.
Note: You can make adjustments to the node sizes, edge thickness, and label sizes by editing the config.json file, and adjustments to the node and edge colours by editing the data.json file.
The last thing to do is to save our project as a .gephi file. Go to File and select Save, give it a name and select Gephi Files (*.gephi) from the Files of type drop-down menu. It saves our layout, colours, sizes and labels. And we are done!
Viewing Exported Webpage Using Visual Studio Code
If you try to open up the newly exported index.html file to view it, you will find that it doesn’t display correctly. That is because newer web browsers block HTML files from running java script locally. There are a number of ways to get around this. Here is one option:
- Install a free software package called Visual Studio Code
- Start it up
- From the Go menu, select Go to File.
- Type in the box: ext install ritwickdey.liveserver
- Press Enter
- Wait for the Live Server to install. It will indicate when it has finished installing on the left panel.
- From the File menu, select Open Folder…
- Browse to the network folder that you just exported and select it. Then click on the Select Folder button.
- The contents of the folder should appear in the left panel. Right click on index.html and select Open with Live Server.
- This should open up the file in your default browser, and you should be able to view it and interact with it.
Technique: Data Visualization | Tools: Gephi