G. Export visualizations as static images
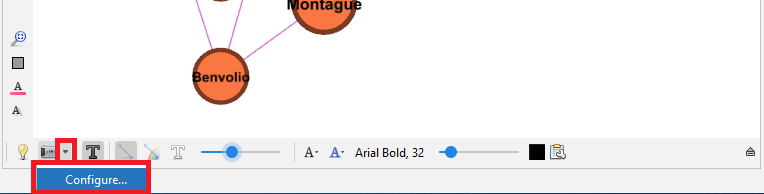
At this point, now that we have adjusted the appearance, we might want to export our visualization. The little camera icon at the bottom left of the main graph pane takes a snapshot of your graph as a PNG image file. Before clicking on it, select its drop-down menu and click on Configure.
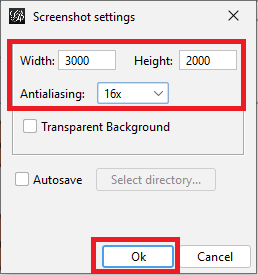
If you keep the defaults and then use the snapshot tool, you will get a low-resolution image; however, if instead you change the image size to 3000 by 2000 for example, and for the Antialiasing, try the maximum of 16x, the resulting snapshot will be a much higher resolution. Change those settings, click OK, and then click on the snapshot tool to take the image.
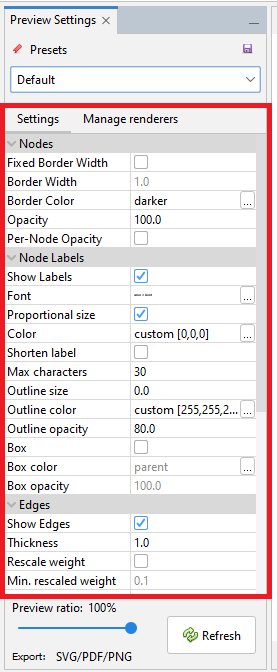
If you want a higher quality image to export, you might need to use the Preview tab. Click on the Preview tab.
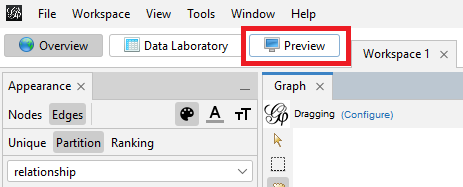
Depending on the plugins you have installed, Gephi may default to showing one of the plugins’ panes as opposed to the “Preview Settings” pane. If Gephi defaults to another pane when you first click on the Preview tab, click on “Preview Settings”.
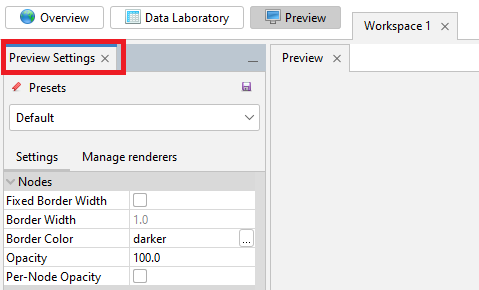
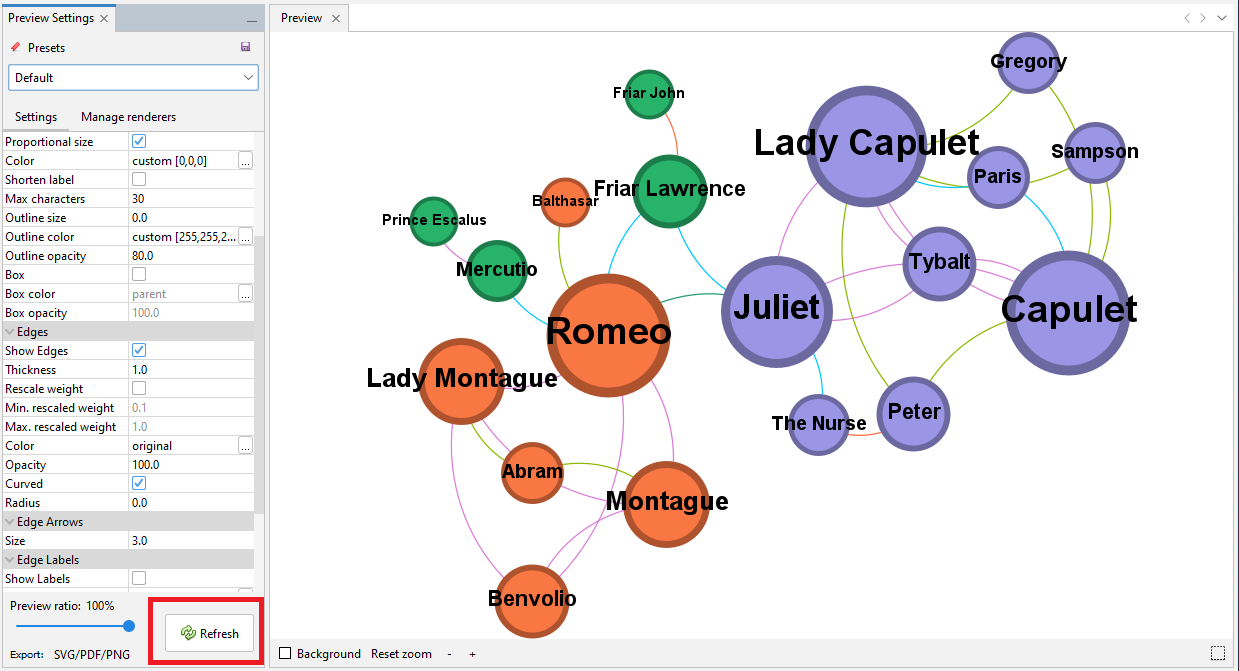
Click on the Refresh button at the bottom left to show the graph.
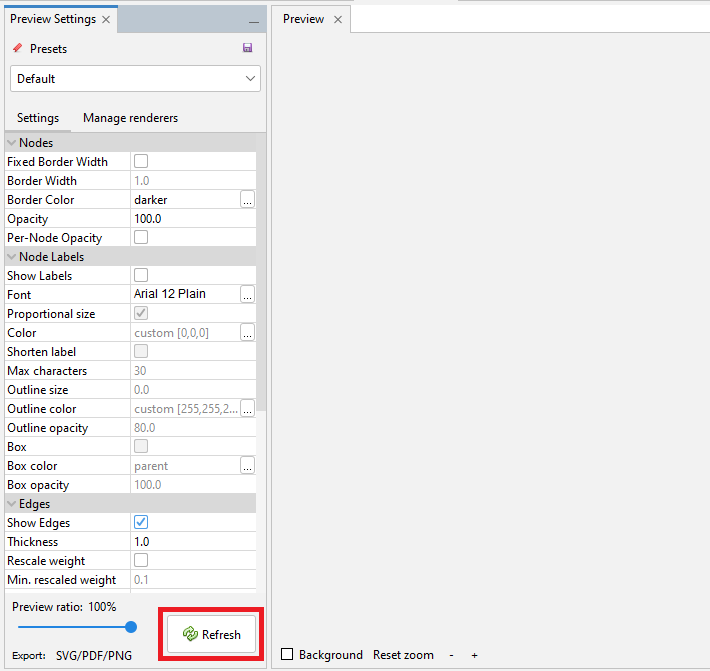
Here you might be surprised to notice that it does not look exactly like the graph you created in the Overview tab.
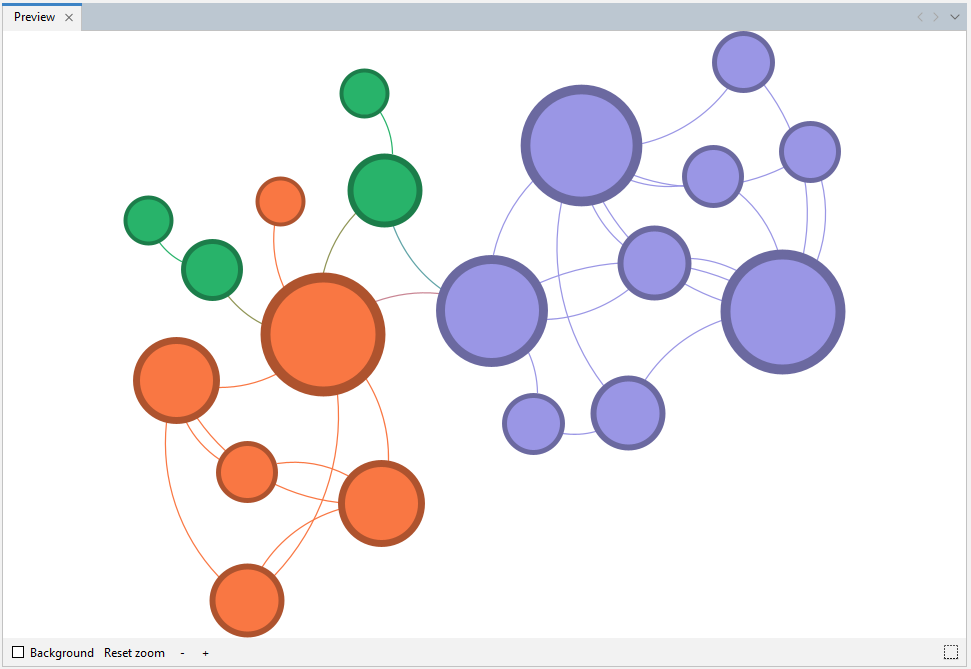
You will have to use the options available on the left of this tab to prepare your visualization again for export.
First, we have lost our node labels. Under Node Labels on the left, select Show Labels and for the Font, select Arial, bold, size 3.
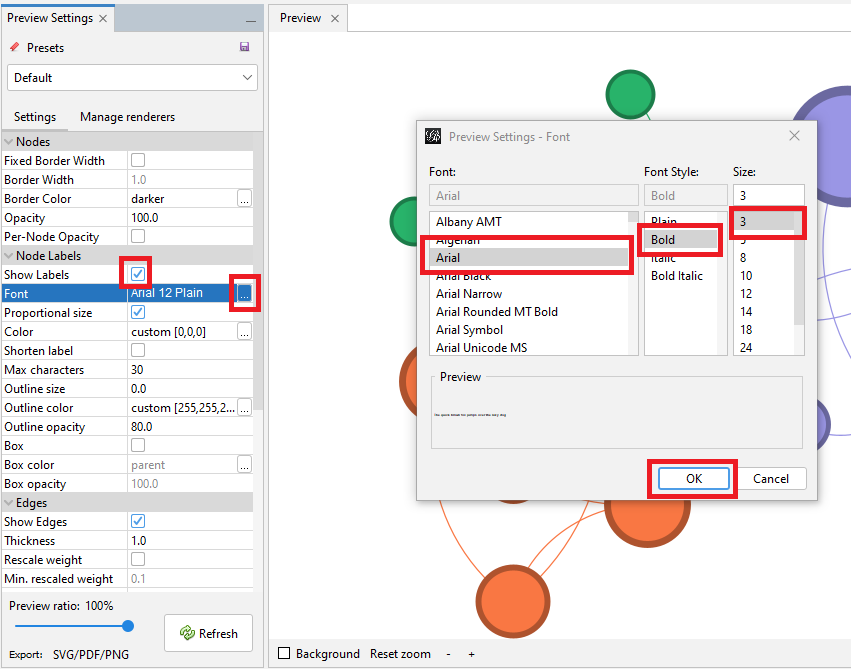
Click on the Refresh button again to see the changes.
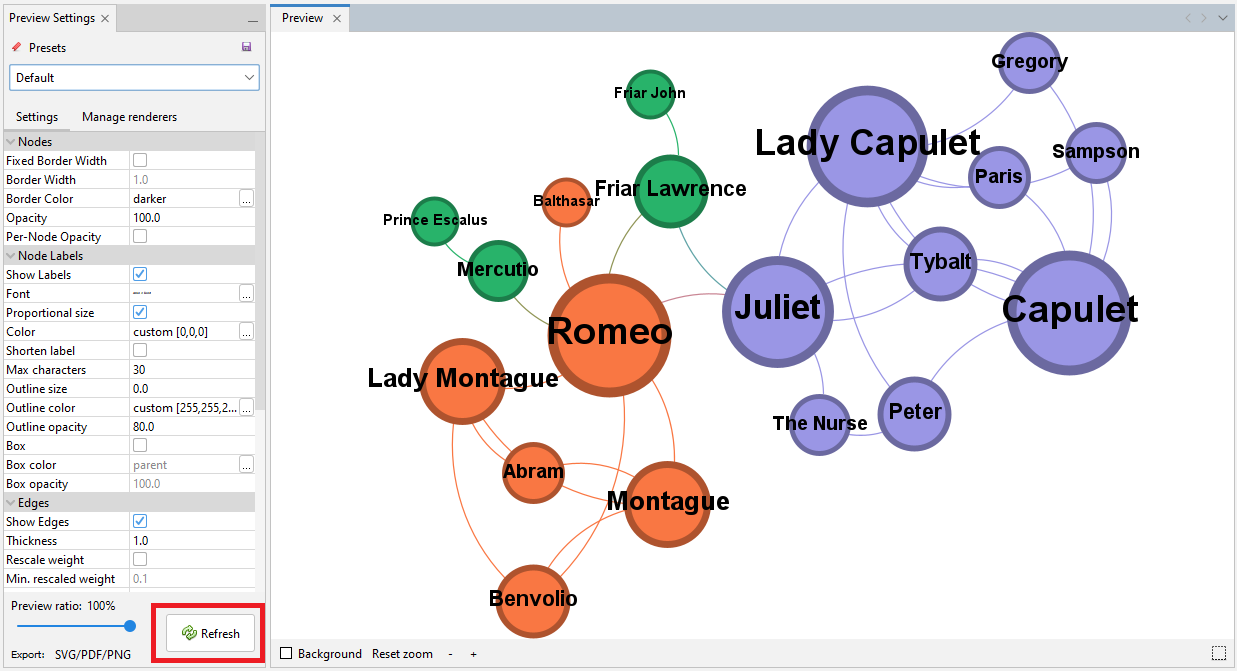
Next, let’s work on the edges, as they have lost their colours. Under Edges on the left, select Color, click on the … button, select Original and then click on OK.
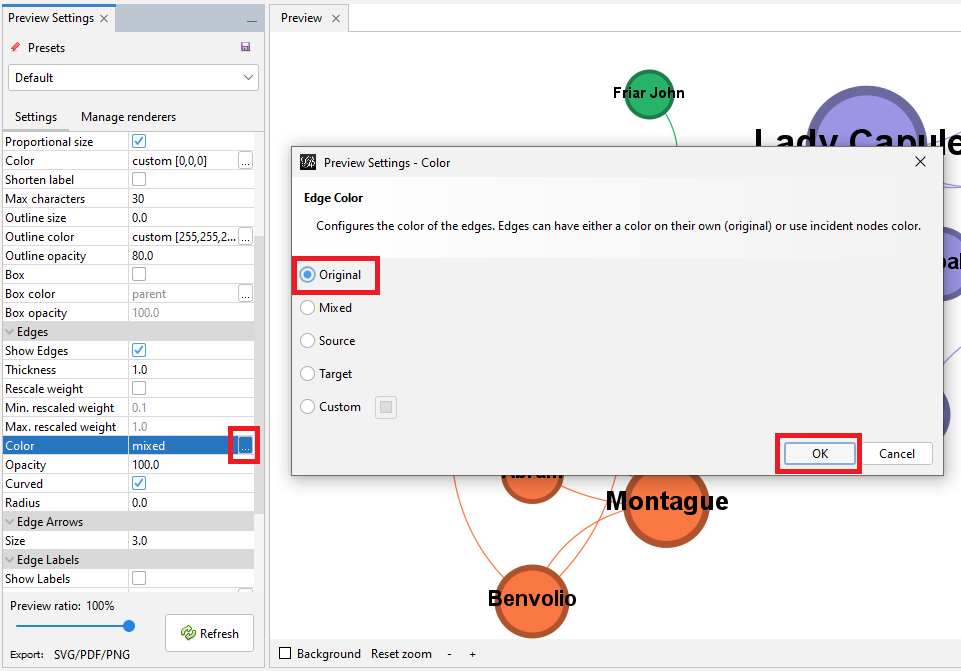
Click on the Refresh button again to see the changes.
As you can see there are many other options to try and experiment with to format the visualization.
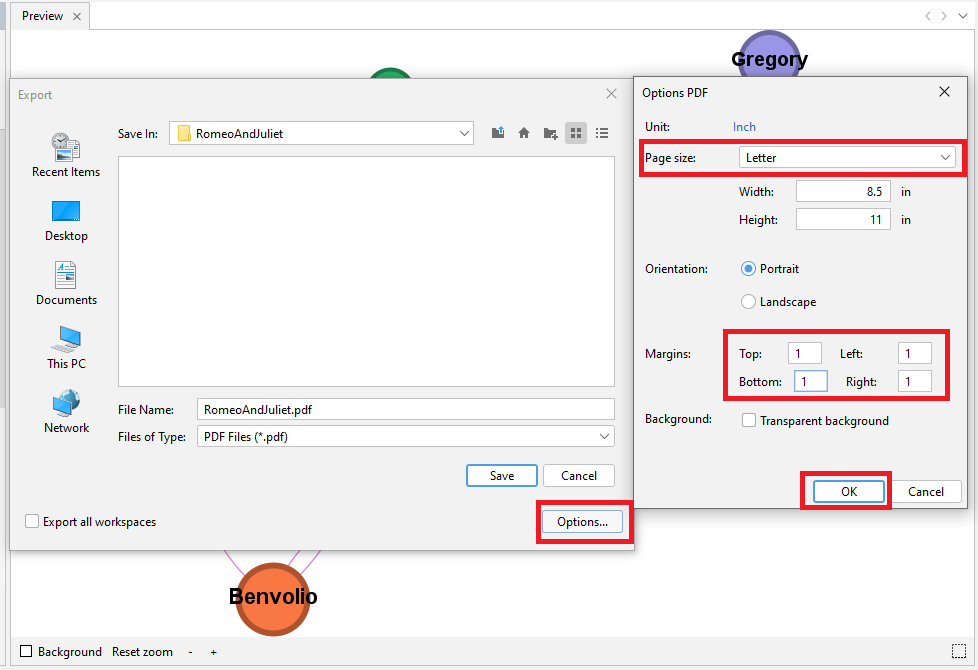
When you are happy with it, click on SVG/PDF/PNG at the bottom next to Export. Let’s export it as a PDF file. Select your desired folder location and give the file a name.
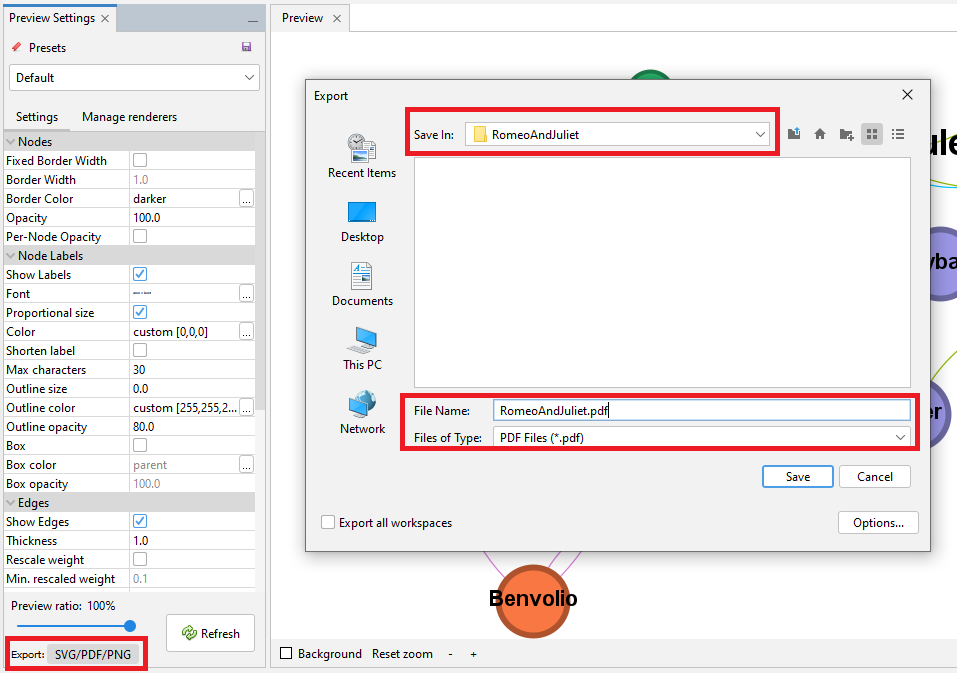
Click on Options… Select Letter for the Page Size and make all the Margins 1 (to try to avoid labels being cut off at the edges, although you may need to play around with these settings, depending on your layout). Click on OK and then click on Save.
You should now have a PDF of your graph. When you open up the file, you will notice that there is no legend included. You would need to use a tool, such as Adobe Illustrator or Inkscape to add a legend to your graph.
Technique: Data Visualization | Tools: Gephi