Matrix Coding and Crosstab Queries
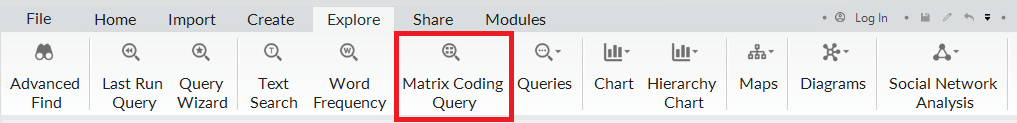
Next up are Matrix Coding queries. These allow you to see coding intersections between two lists of items. It is called Matrix Coding Query in the Explore Ribbon menu or described as “Find coding intersections between two lists of items” in the Query Wizard. So for example, let’s say you want to see which interviewees (based on cases) had the most positive and negative attitudes (based on coding) - you can do this with a Matrix Coding query. Go to the Explore menu and select Matrix Coding Query.
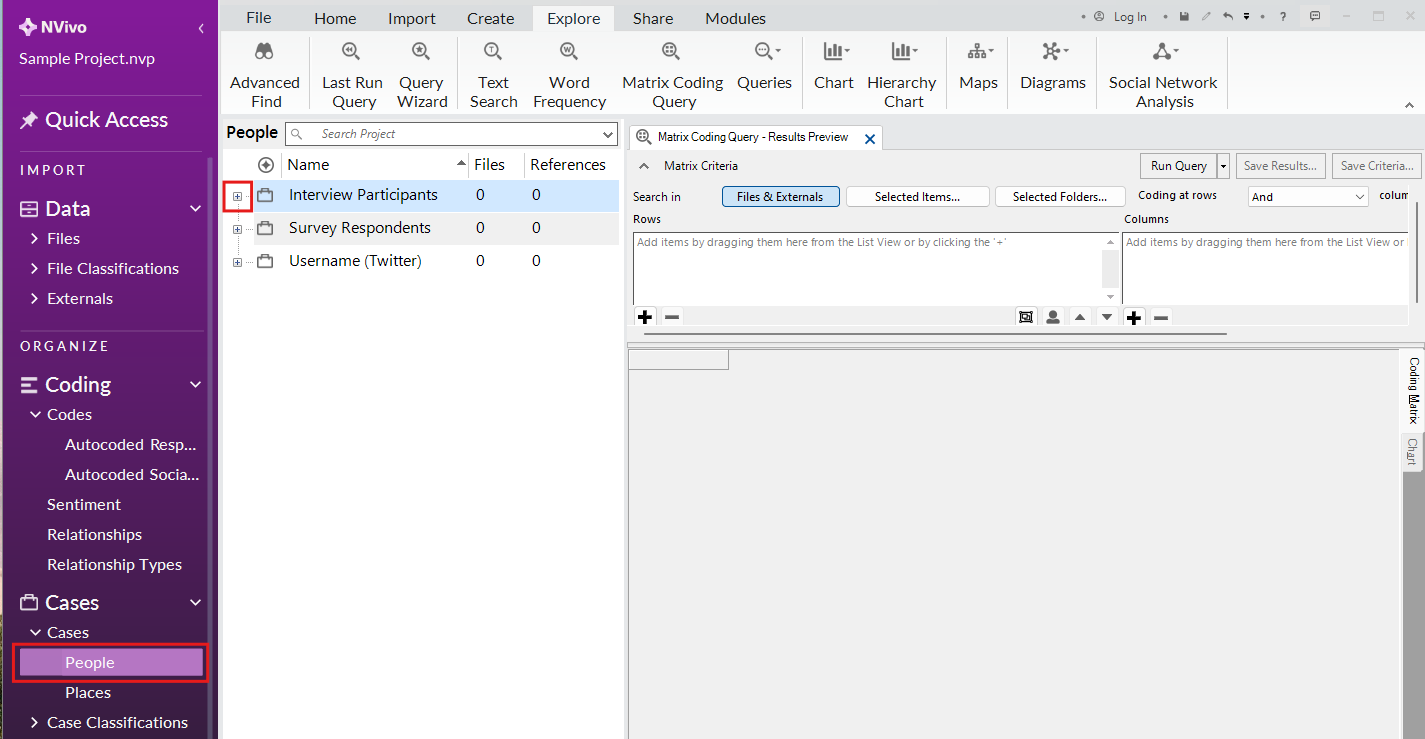
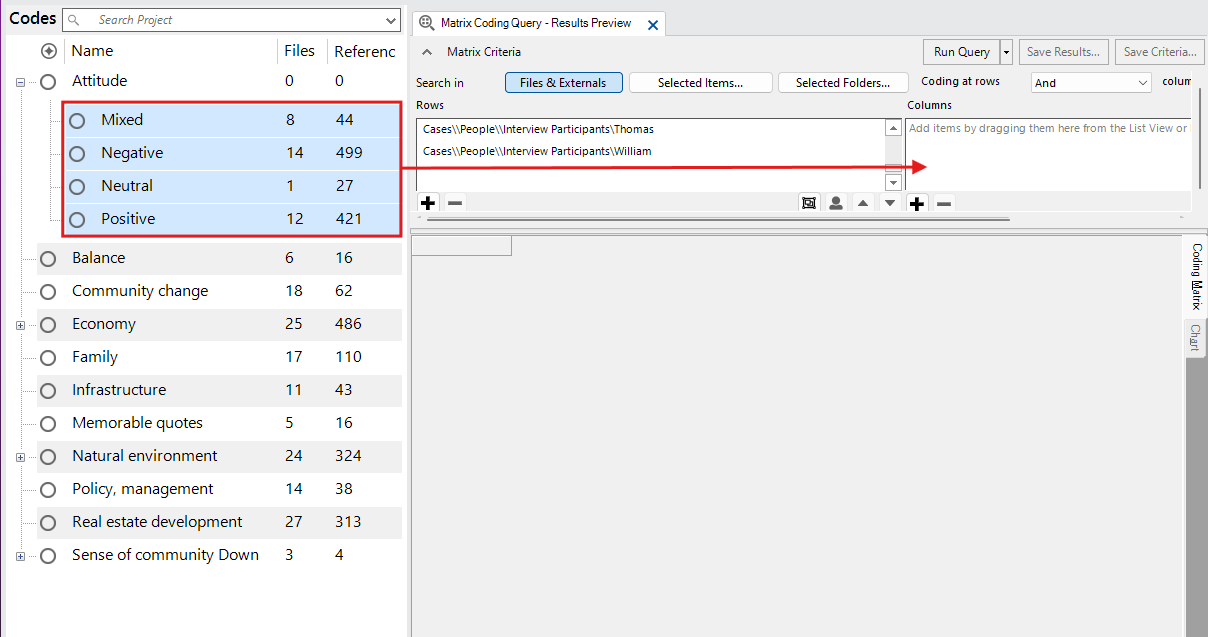
This query can be formed using drag and drop. First, using the left menu, under Cases, go to People, and then expand Interview Participants.
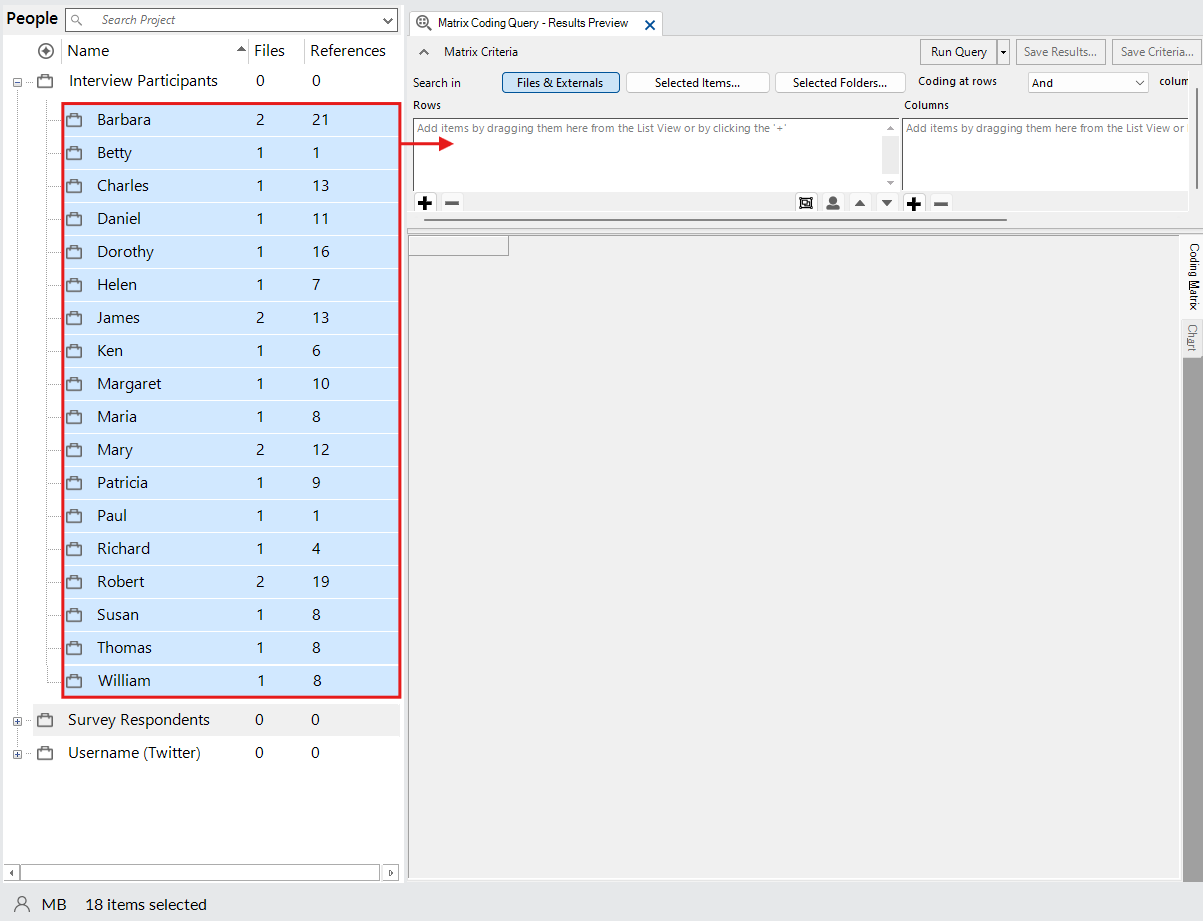
Highlight all of the interviewees by clicking on the first one, holding down the Shift key, and then clicking on the last one. Then drag and drop them on the left side of the matrix query under Rows.
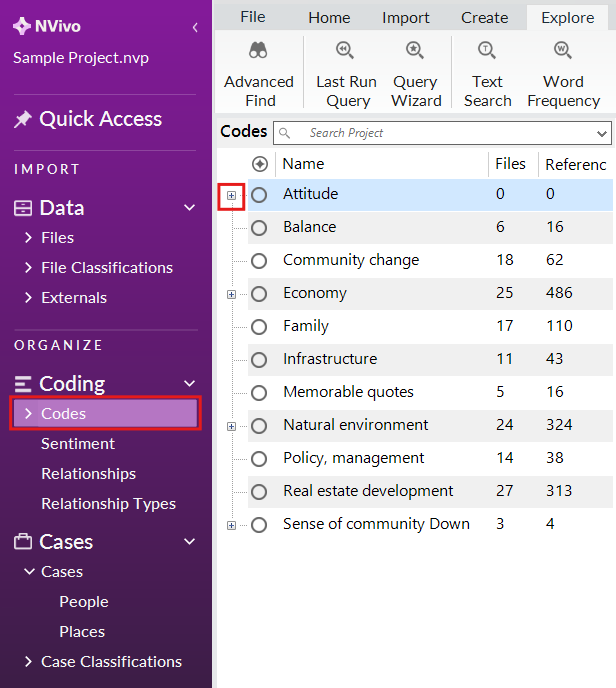
Then, using the left menu, under Coding, click on Codes, and then go to Attitude and expand it.
Highlight all the attitude child codes and then drag and drop them on the right side of the matrix query under Columns. Note: If you find the drag and drop difficult, you can also use the plus signs below the areas for rows and columns to manually select items from a list.
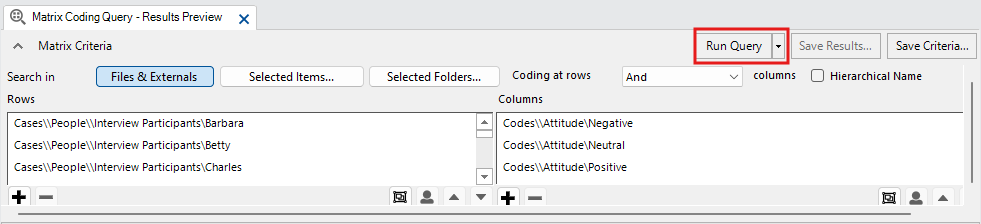
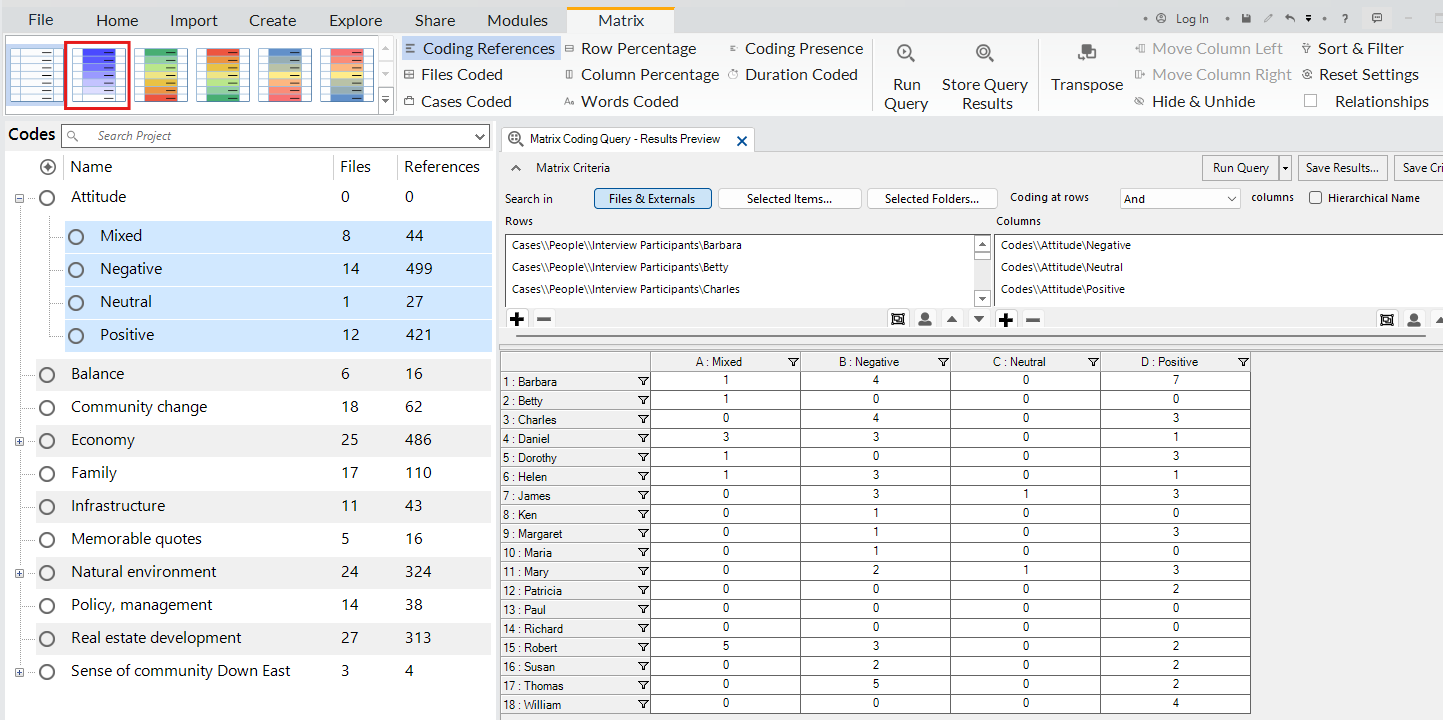
Click on Run Query to see the results. You will see a grid or matrix with the number of references where those codes and cases intersect.
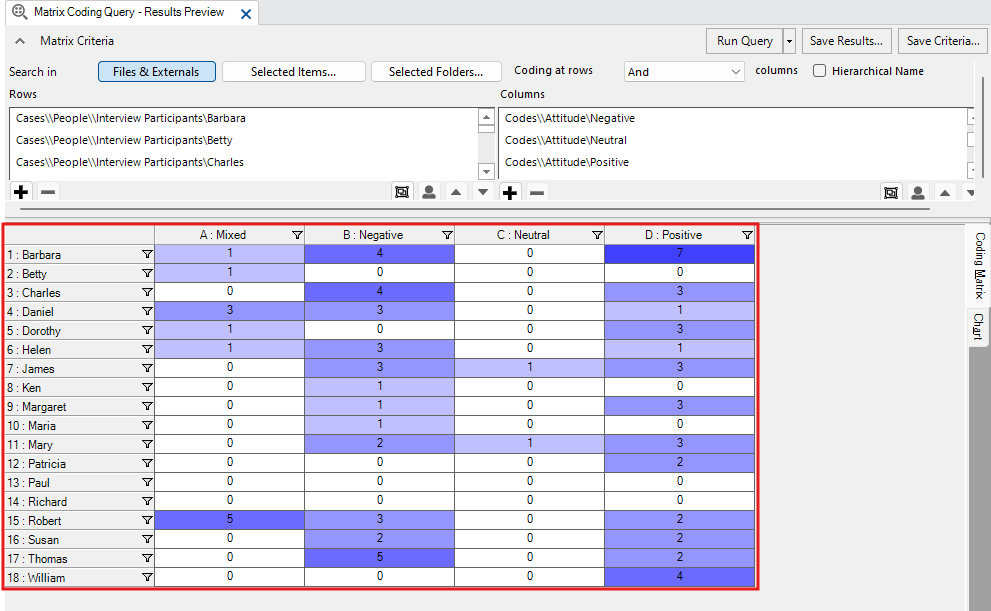
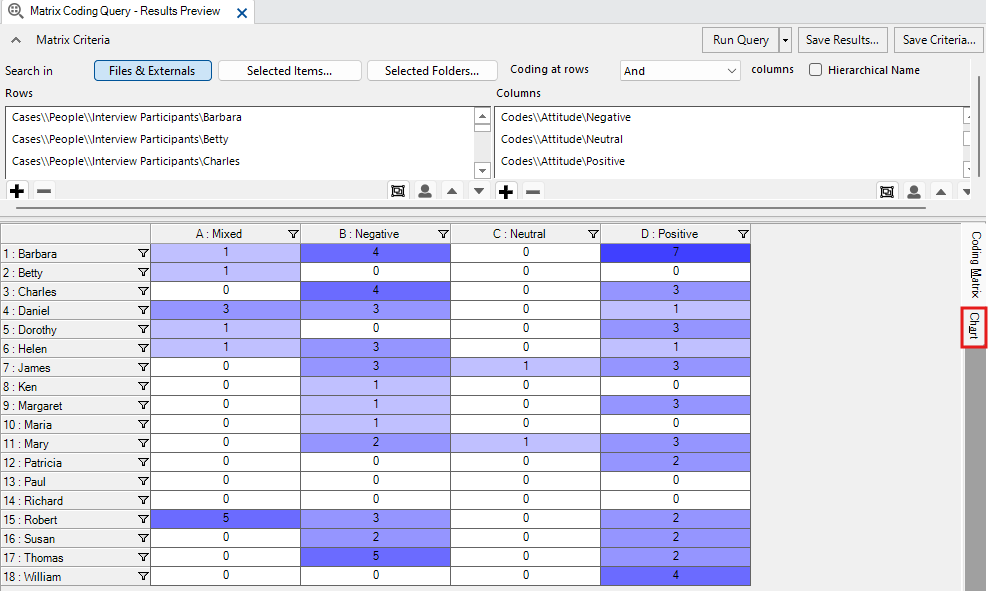
To see the results more clearly and point out interesting patterns, use the shading options available from the top left of the Matrix ribbon menu. Select the purple option.
We can see that the darker the purple, the more two items intersect. In this case, we can see for example that Barbara had strong positive and negative references, Thomas’s interview was more negative than positive, and William’s was only positive.
Click on the Chart tab on the right.
You will see the results displayed in a chart. The default is a 3D bar graph, which is not a great choice.
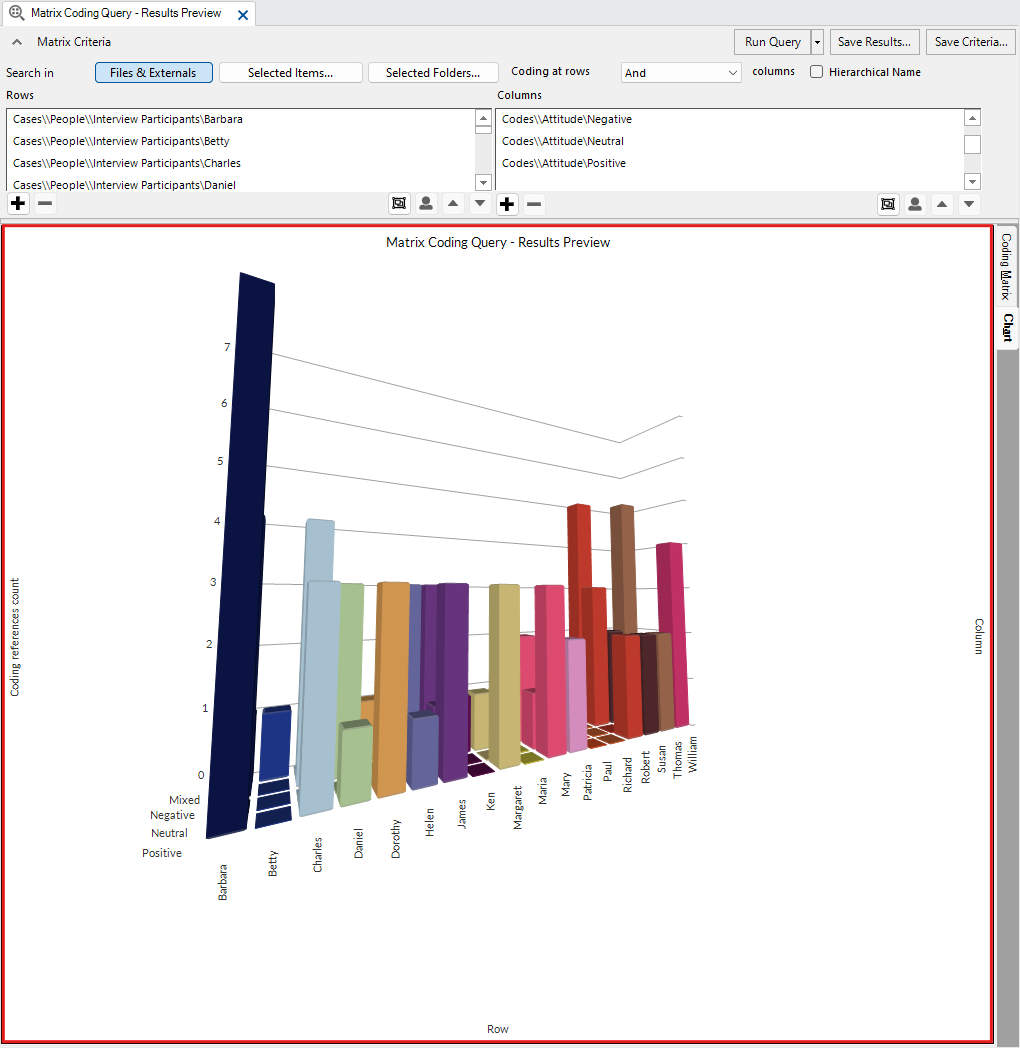
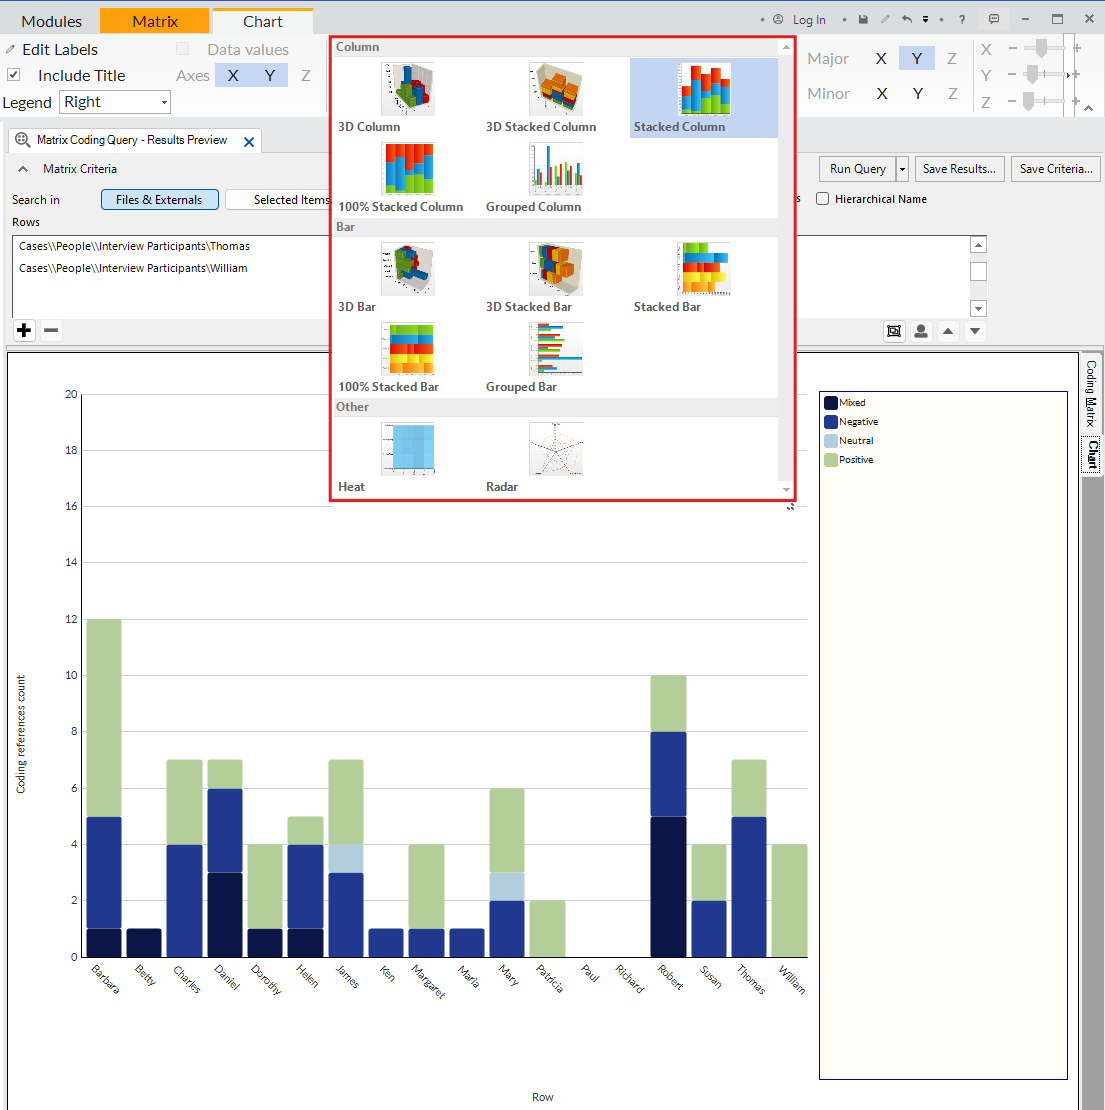
You can select other chart types from the Chart ribbon menu above to change it, such as the Stacked Column chart to see a clearer visualization. Again, NVivo’s visualization options are limited, and these graphs are often not the best way to display your data. In this scenario, the shaded matrix view we saw initially already offers a nice visualization of the data.
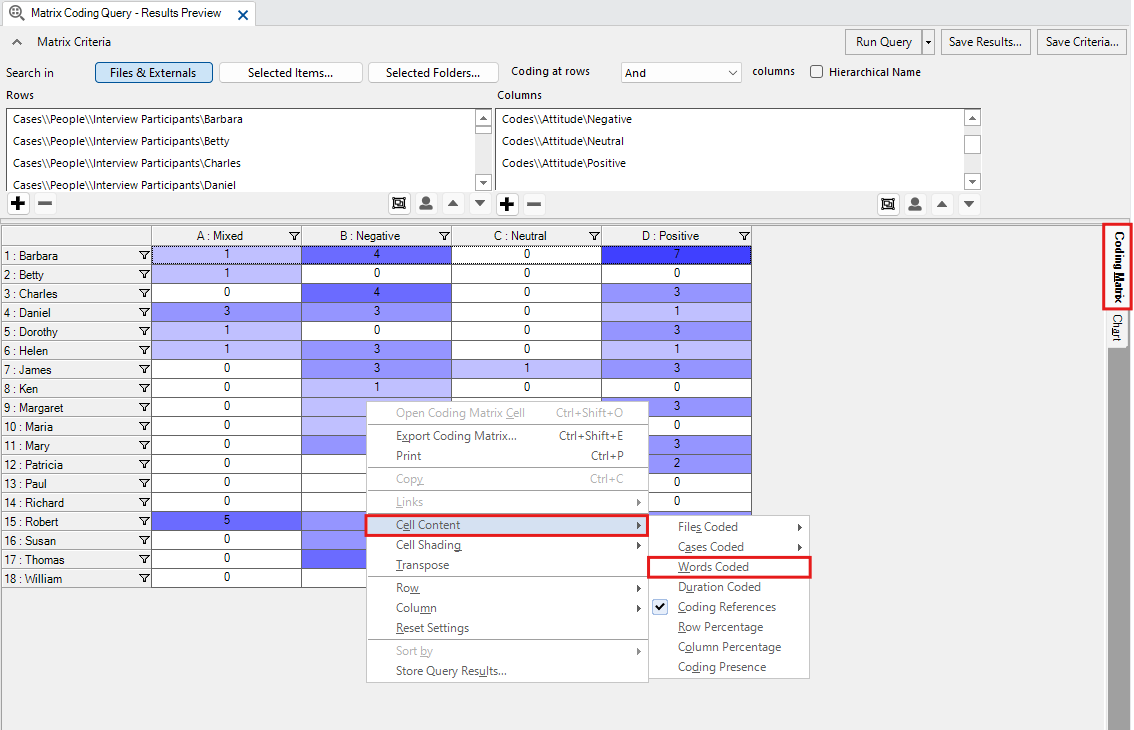
Click on the Coding Matrix tab on the right. Then right click on the table, and go to Cell Contents. You will see that the default number shown is coding references, but there are a lot of other options to consider to explore the data in different ways. For example, if you change it to Words Coded, you can see that Charles had a lot of negative things to say. Once you have finished examining the results, close the query results tab.
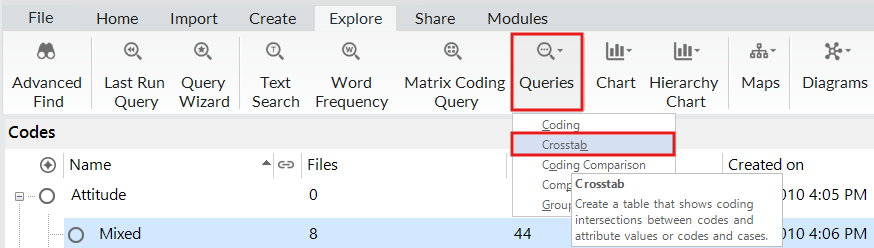
Let’s move on to the last query we will look at, Crosstab queries. Crosstab queries are similar to Matrix Coding queries, but you can expand out all the categories for an attribute along the columns automatically. For example, to determine which codes came up most by Township of respondent. Go to the Explore menu, and from the Queries drop-down menu, select Crosstab.
This query is partially formed using drag and drop. First, using the left menu, under Coding, select Codes. Highlight all the top-level codes (make sure none of the Code categories are expanded) and then drag and drop them on the left side of the Crosstab query tab under Codes (or again you can use the plus sign to manually select the codes you want.)
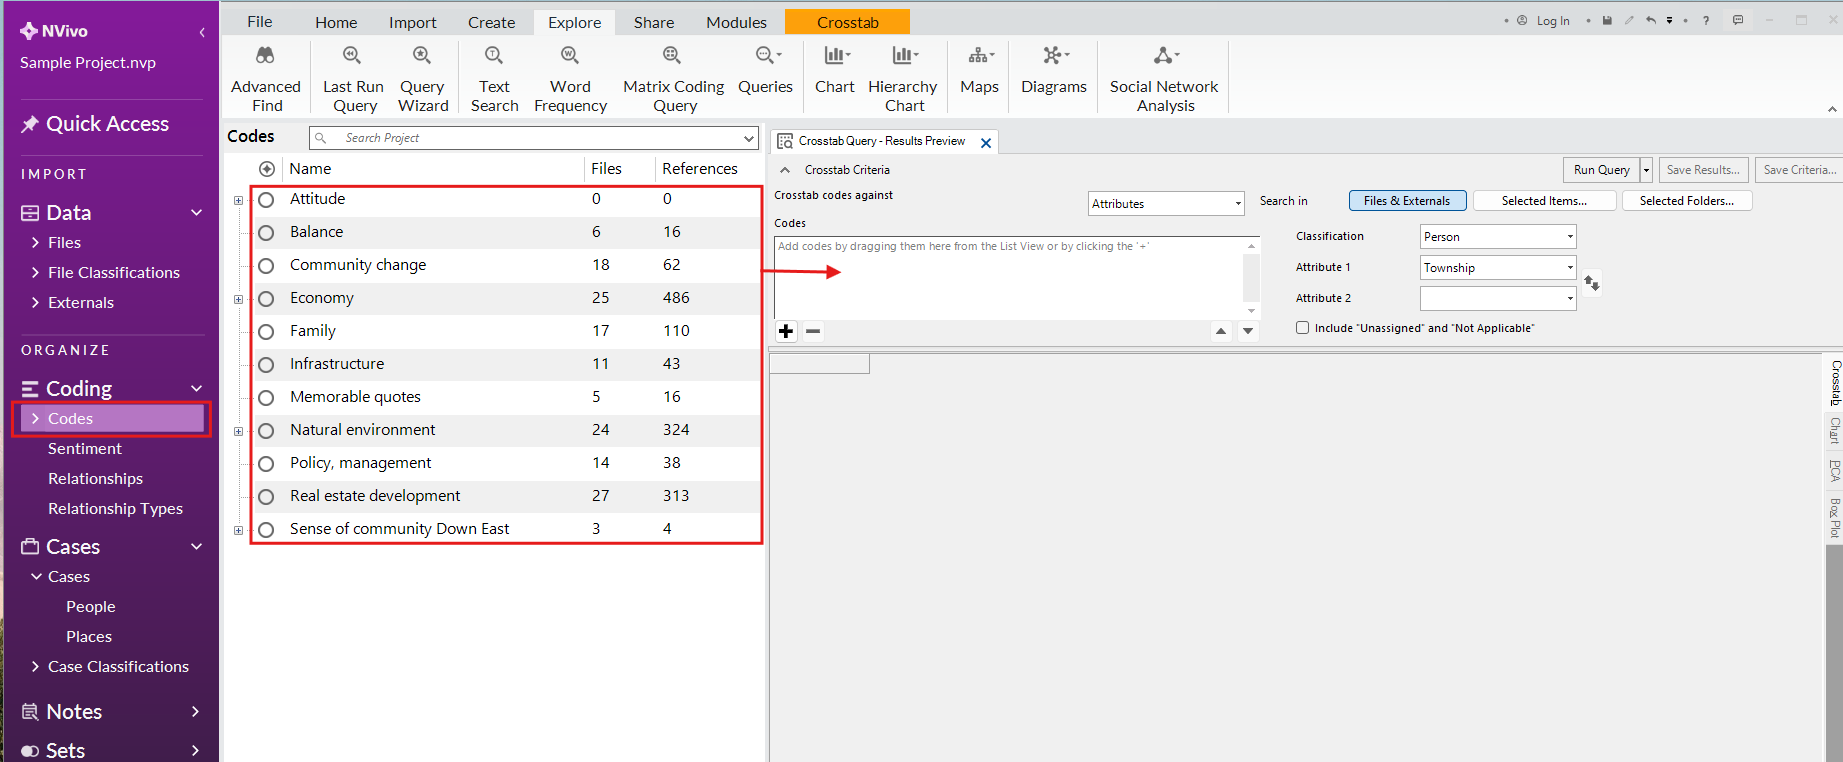
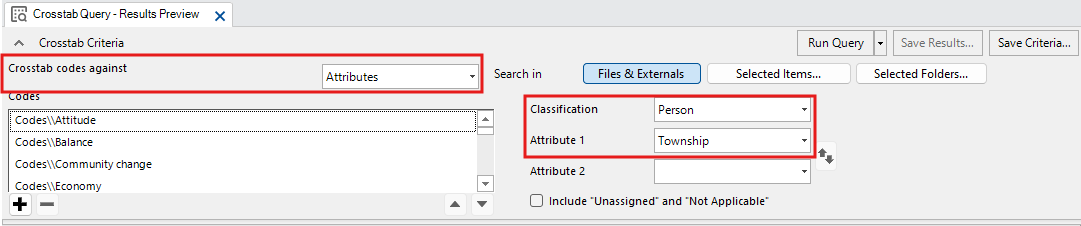
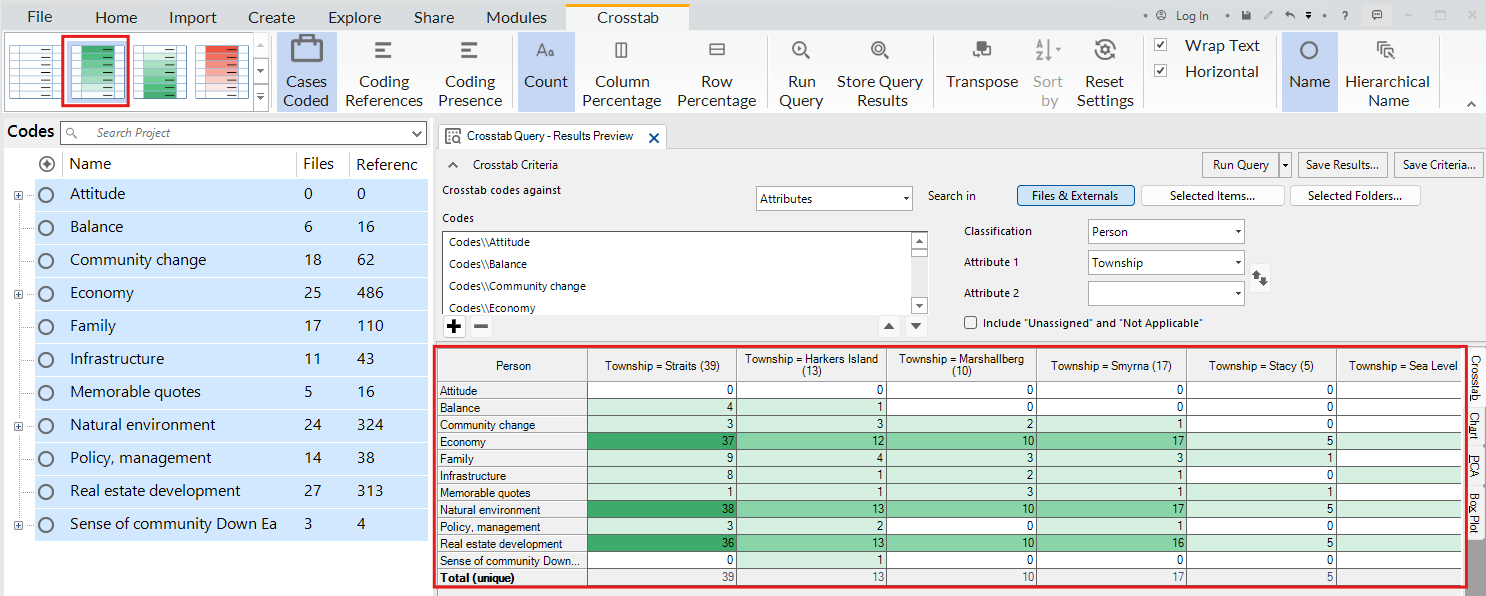
The default option for the Crosstab is codes against attributes. For Classification, select Person, and for Attribute 1, select Township, from the drop-down menus. This Crosstab query will create a matrix where the codes are along the rows, and for the columns, it will take all the values of one attribute (in this case, Township) and use those for the column headers. Then it will tally where they intersect.
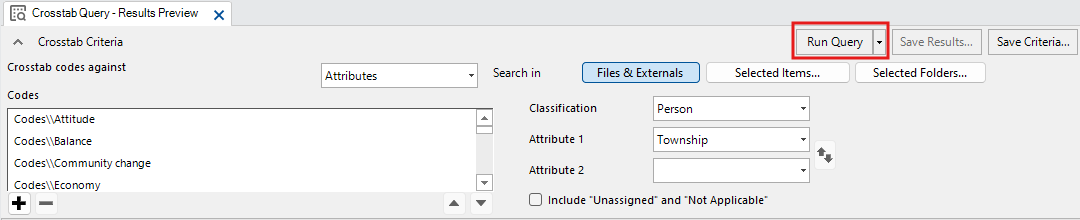
Click on Run Query to see the results. You will see a matrix with the number of references where those codes and attributes intersect.
Like with the Matrix Coding, use the shading options available from the top left of the Crosstab ribbon menu to see the patterns more clearly. If we select the green option, we can see that the darker the green, the more two items intersect.
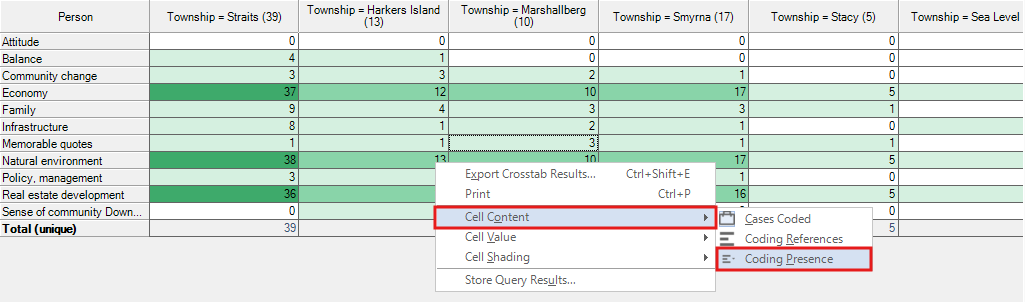
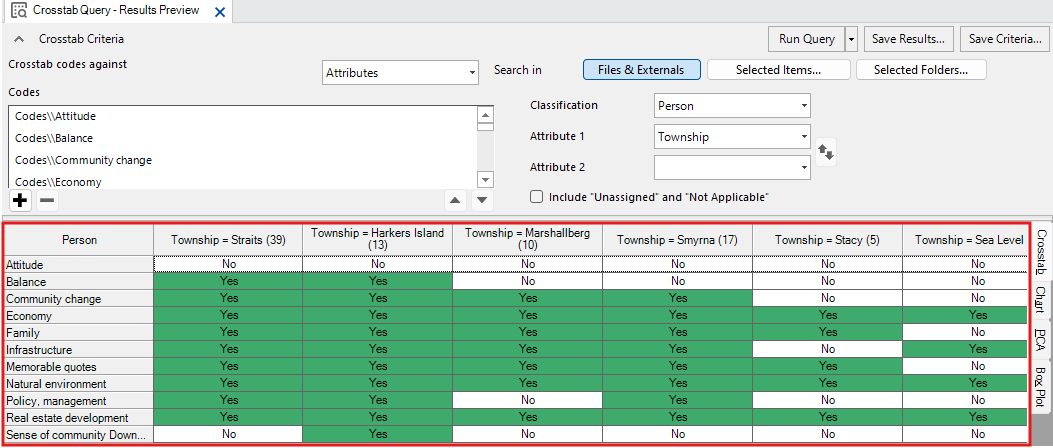
Again, we can right click on the table, and go to Cell Contents to change what is displayed. In this case, try selecting Coding Presence. Often times you might not have a big enough data set or it might not be appropriate to gain meaning from the numerical values for coding references, for example, but you can at least see where there is an intersection at all or not. For example, we see that the code “Sense of Community” has only been used on data for a few townships. People don’t always report these numbers and matrices, but use them to gain insight into their project.
You’ll see that NVivo also offers three other query types: Coding Comparison Queries, which are used when working on a team to see how much agreement there is between team members on coding, and Compound and Group Queries that are used to create more complicated queries. While these will not be covered in this tutorial, you are encouraged to play around with these queries on your own time to learn more.
Test Your Understanding 3
Using the Explore menu options run a Matrix Coding query on social media content only, where the columns are the attitude child codes (positive, negative, etc.) and the rows are the remaining top-level codes (Balance, Economy, etc.). What two codes have the most negative references?
Next run a Crosstab query, where the rows are the top-level codes (Balance, Economy, etc.) and the Person attribute is Education Level. What code was coded the most by coding references for people whose highest level of education completed is undergraduate college?
Click here for the answers.
Technique: Qualitative Data Analysis | Tools: NVivo