6. Creating a Simple Treemap
Go to the top Data Menu and select New Data Source. Select Excel and choose the 2016PopulationbyRegion.xls file. This dataset lists population totals for various regions on earth.
Again, once you are happy with your data in the data source view, you can create a new worksheet to start building a new visualization by clicking on the new worksheet icon (same as before - to the right of Sheet 3 at the bottom left-hand corner).
Treemaps help show hierarchical divisions of parts within a whole. To create a treemap in Tableau, first drag the Region variable onto the Label (text) box in the Marks card, as we’re going to separate and label each box with the Region name. 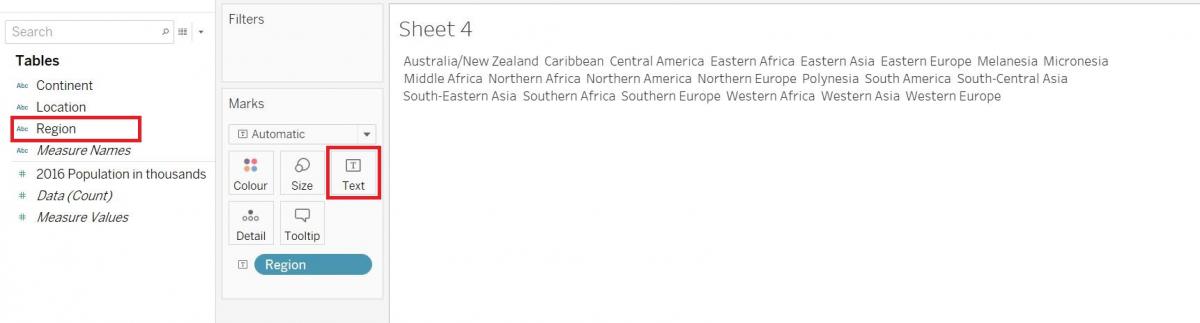
Next drag the Population variable onto the Size box as we’re going to size these regions blocks by their population. 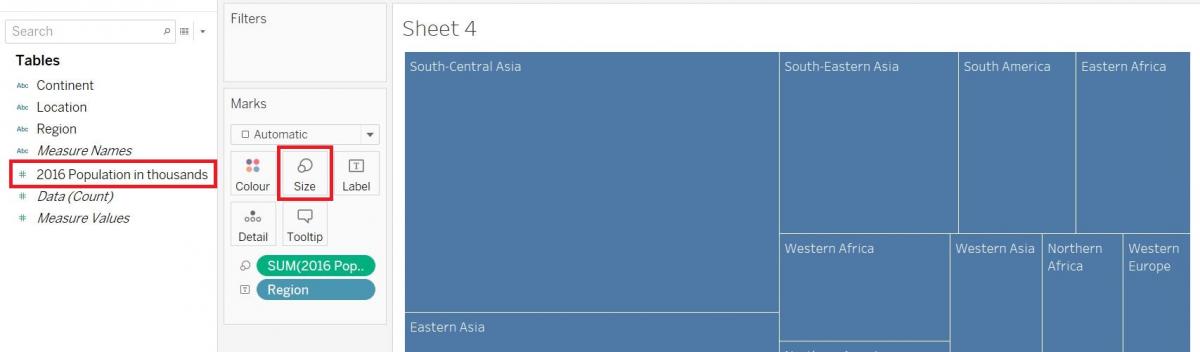
Finally, drag the Continent onto the Color box to colour code the blocks by continent. 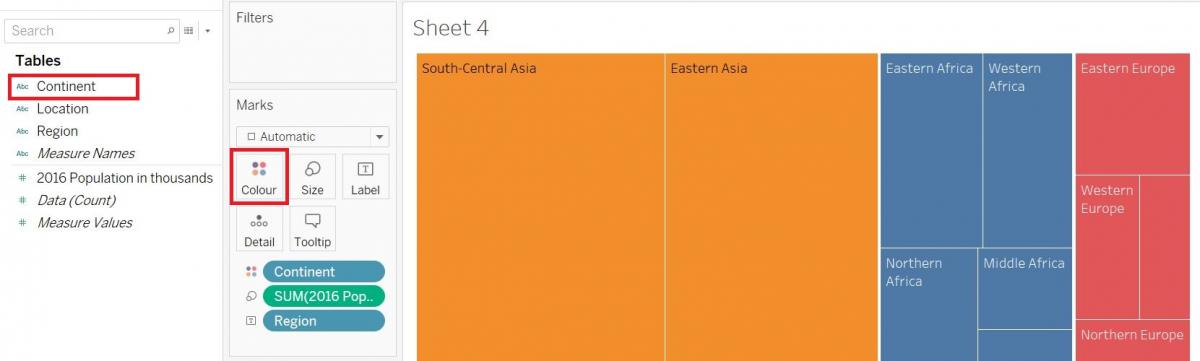
You can hover over the blocks to get more information on the populations, or you could label it as well. Drag the Population variable again over the Label box to include that information under the region name. You have completed a simple treemap! 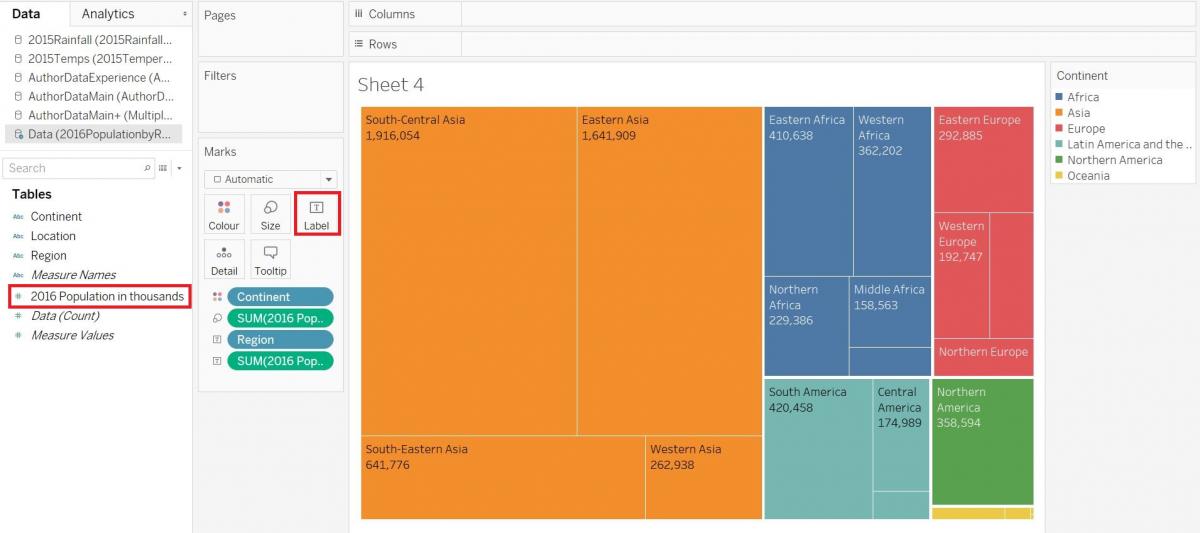
Technique: Data Visualization | Tools: Excel, Tableau