7. Creating a Stacked Bar Chart and Using Parameters
Go to the top Data Menu and select New Data Source. Select Excel and choose the RomeoAndJulietWordFrequenciesByAct.xls file. This dataset lists word frequencies in Romeo and Juliet by Act. Make sure to check how your variables are classified – note that “Act” is classed as a numeric variable when we know it is a string. You can change this now, as we did before, but we will also show you how to change this later in the guide (in the event you didn’t notice this when you initially imported your dataset into Tableau!). 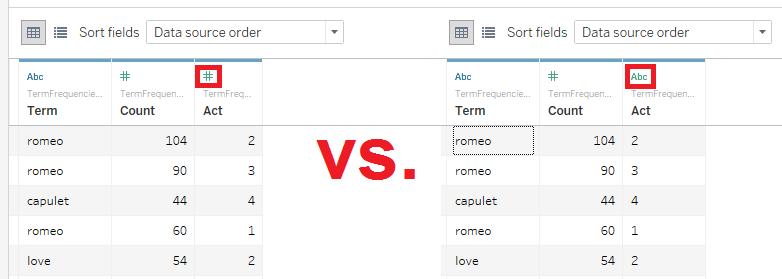
Again, once I’m happy with my data, I can start building a new visualization by clicking on the new worksheet icon.
Hold down the CTRL button (on your keyboard) and click on the Term variable and the Count variable, then click on the Show Me tab to expand it. I see that a horizontal bar graph is one of the recommendations (i.e., not greyed out) – select it. Your graph should resemble the image below. 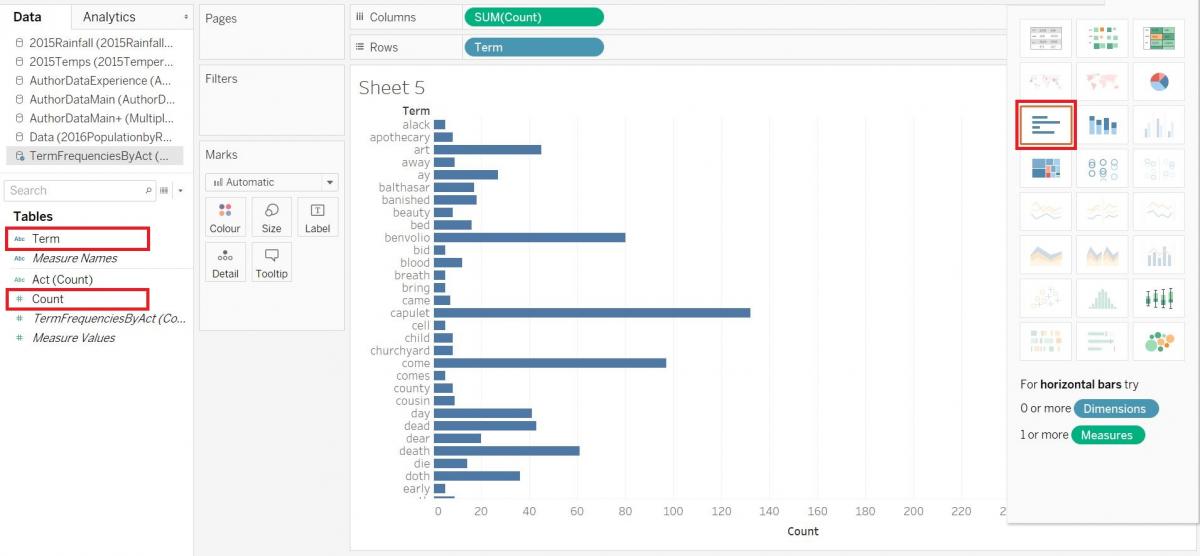
Now let’s filter it so we only see the top 10 words mentioned. Drag the Term variable to the Filters shelf. Go to the Top tab, and select By Field. By default it is going to use the Count variable and sum up the instances to get the top 10. Click OK. 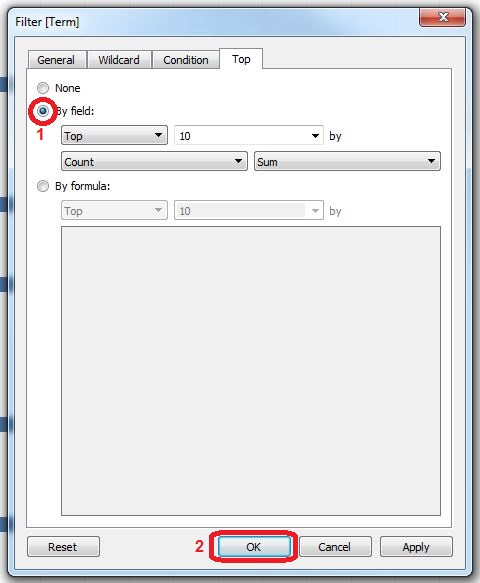
Now you will have your top 10 terms, listed in alphabetical order by term. It might be nicer to sort them by count. We can do this by right-clicking on the Term pill in the Rows section and select Sort. In the Sort By section, select Field. Under Sort Order, select Descending. Leave the rest of the defaults selected, as these will give us the sum of count. You’ll notice there is no “OK” or “Apply” option. Changes are applied automatically, so simply click the X in the top right of the Sort window. 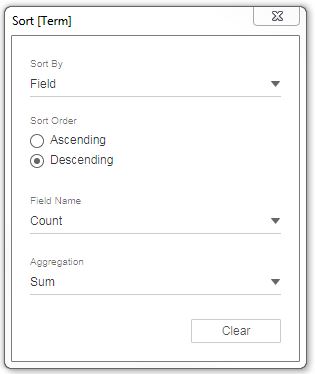
Result: 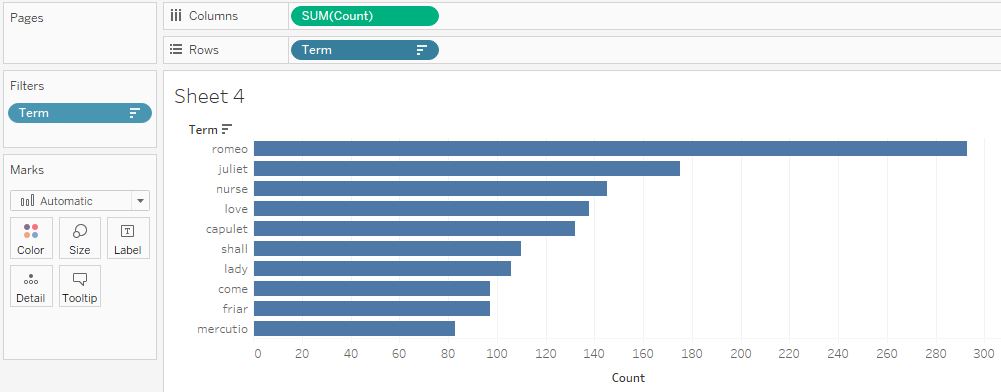
Now suppose I’d like to add information about the Act to make a colour-coded stacked bar chart. If you did not change the Act variable to a string at the beginning of this section, you will notice that when we look at what variable types Tableau has identified, it thinks the Act variable is a numeric variable in the measures section, when really it is categorical in this case. If necessary, let’s change it by moving it to our dimensions section. Firstly, drag the Act variable into the Dimensions section.
Now it is a category, so it makes sense to visualize it through colour. Secondly, drag the Act variable onto the Color box in the Marks card. Looking better, but the Acts seems to be showing from Act 5 to Act 1. We can fix that by right-clicking on the Act pill and thirdly selecting Sort. Select Descending and then click the X. 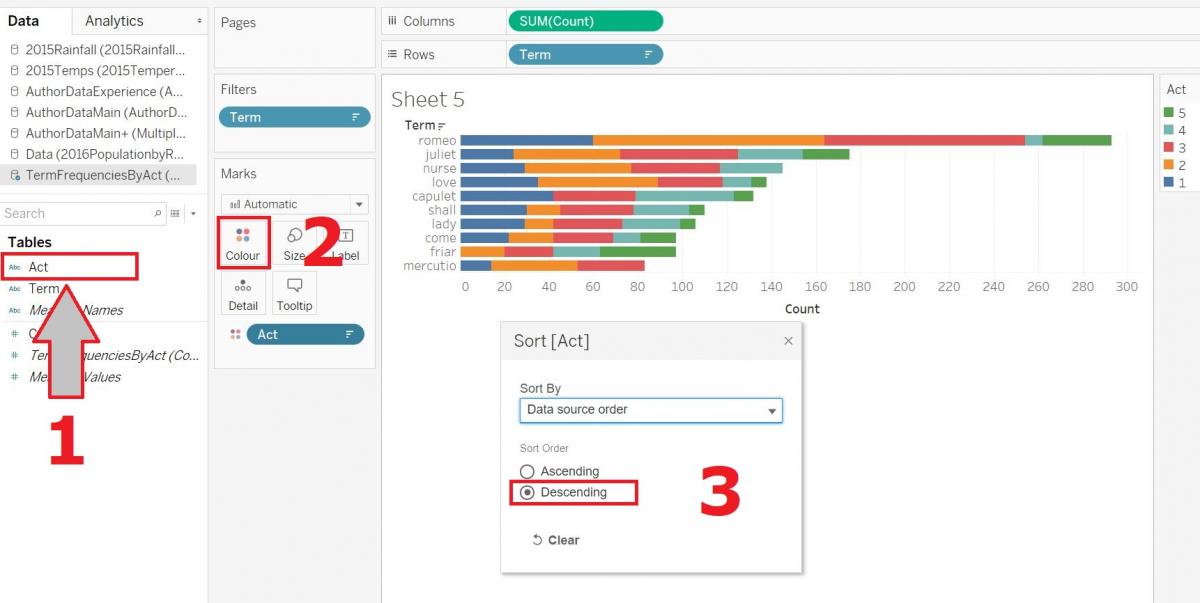
So now we have our top 10 terms, subdivided by Act; however, what if our audience would rather just see the top 5 terms, or would like to expand it out to the top 20 or 30 terms. We can get an audience’s input into our visualizations using parameters. Right-click on Term in the Filters shelf, and select Edit Filter… Go to the Top tab and click on the drop-down arrow next to where 10 is specified. Select Create a New Parameter… Give it a name, such as Top Number. Go down to the Range of Values section. Set the minimum to 5, the maximum to 30, and the step size to 5. Then click on OK, and click OK again on the Filter window. 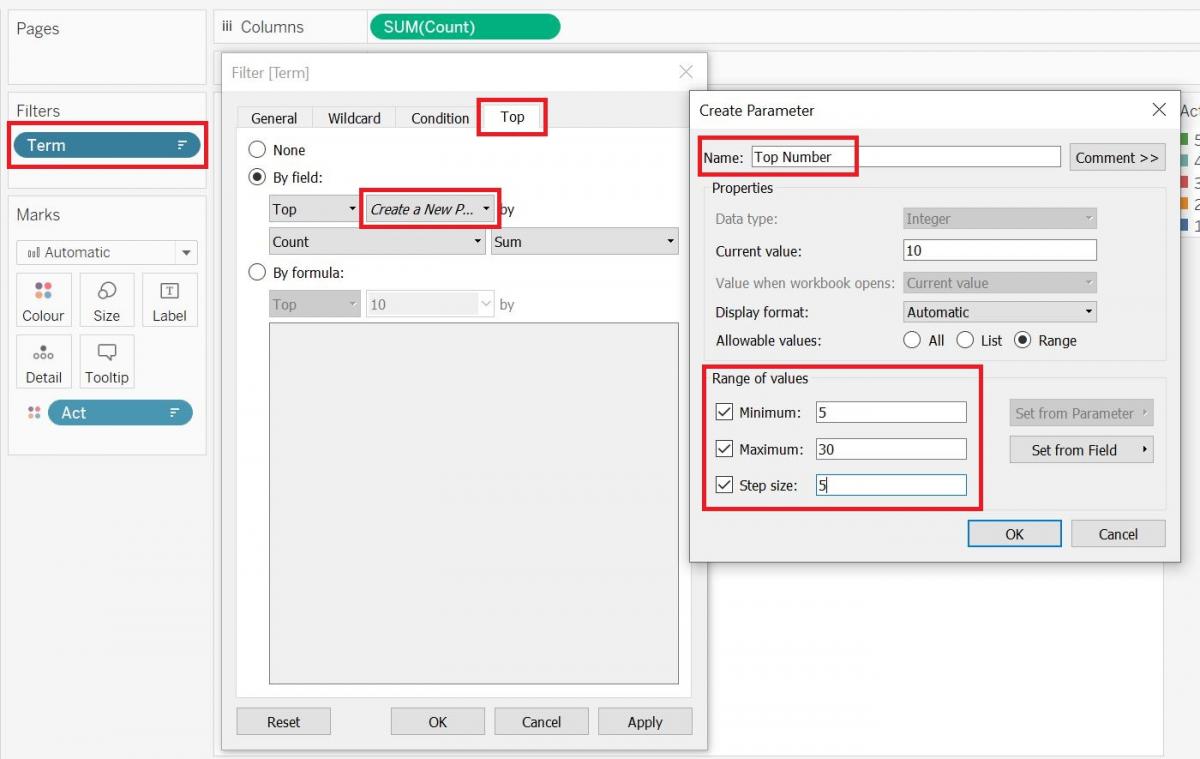
Your Top Number parameter should show up on the left side, under your variables. Right click on it, and select Show Parameter.
Your final product should resemble the image below. Your audience can use the control on the right to adjust how many terms to see in their top terms list. 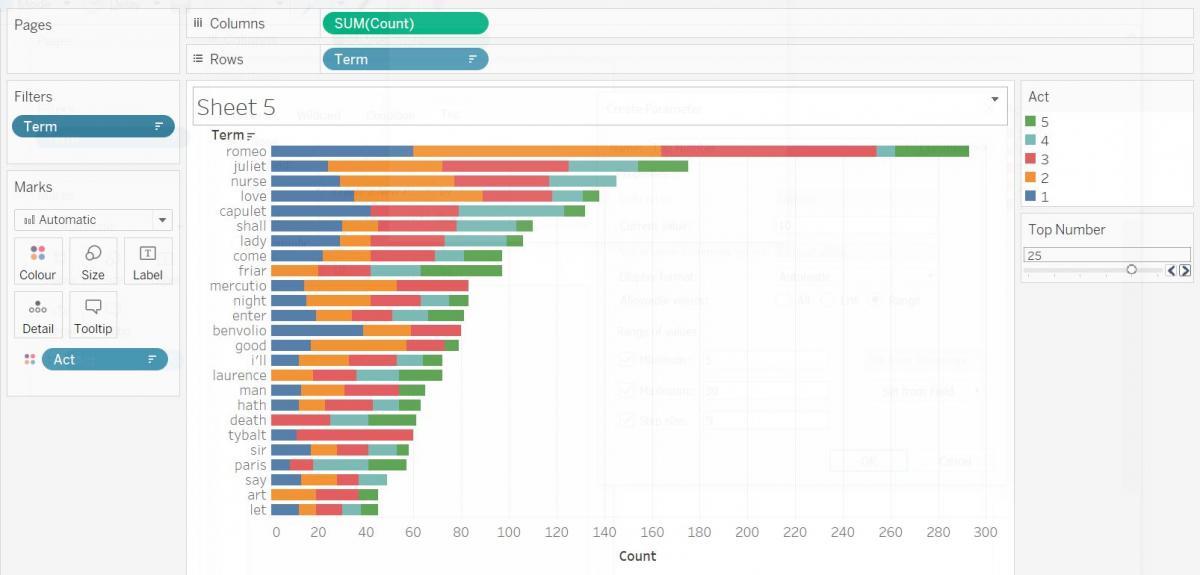
Technique: Data Visualization | Tools: Excel, Tableau