Creating Stories
So here we have created a dashboard to give the reader an overview of sales and profit by Sub-Category, with the option to filter by state. But what if your message or dashboard needs are even more complex. Then you might turn to creating a Story in Tableau, which is a combination of dashboards and worksheets that a reader would page through sequentially or in any order they choose to gain further insight. Let’s create a simple story that looks more broadly at sales and profit by region, and goes further into the details by looking at it by state and over time.
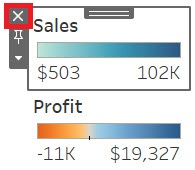
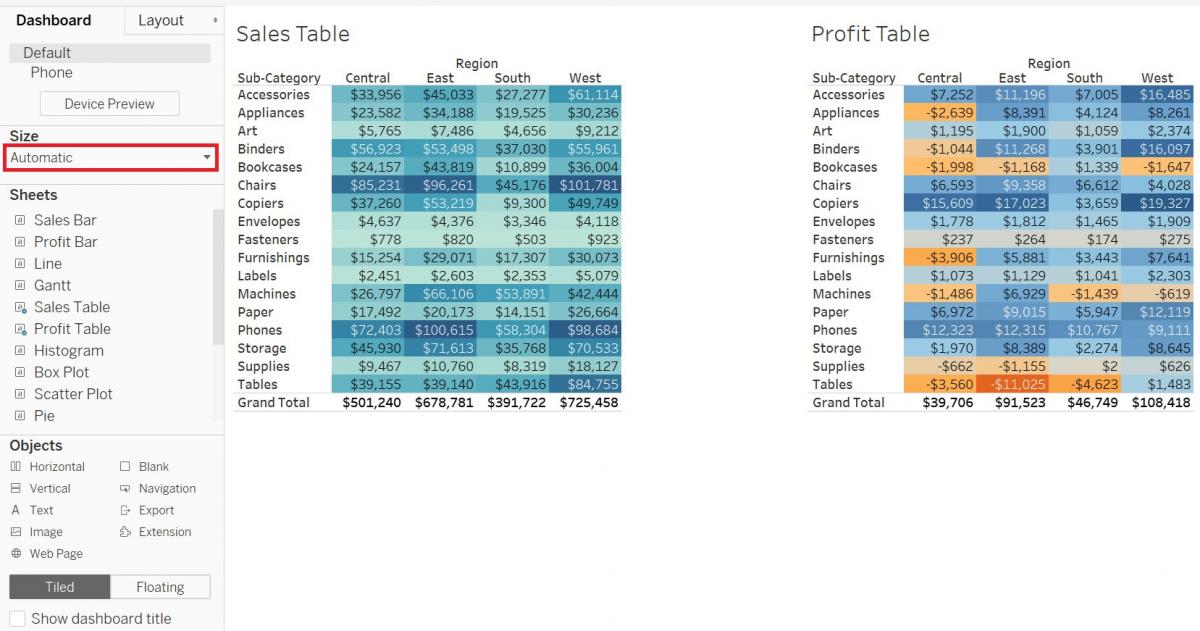
First, we need to quickly create a second dashboard to add to our story. Click on the new dashboard icon. As this is just to demonstrate, just drag in the Sales Table sheet and then the Profit Table sheet beside it. Select each legend box and click on the X to remove them from the dashboard, as they are not needed here.
Under Size on the left, change Fixed size to Automatic.
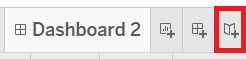
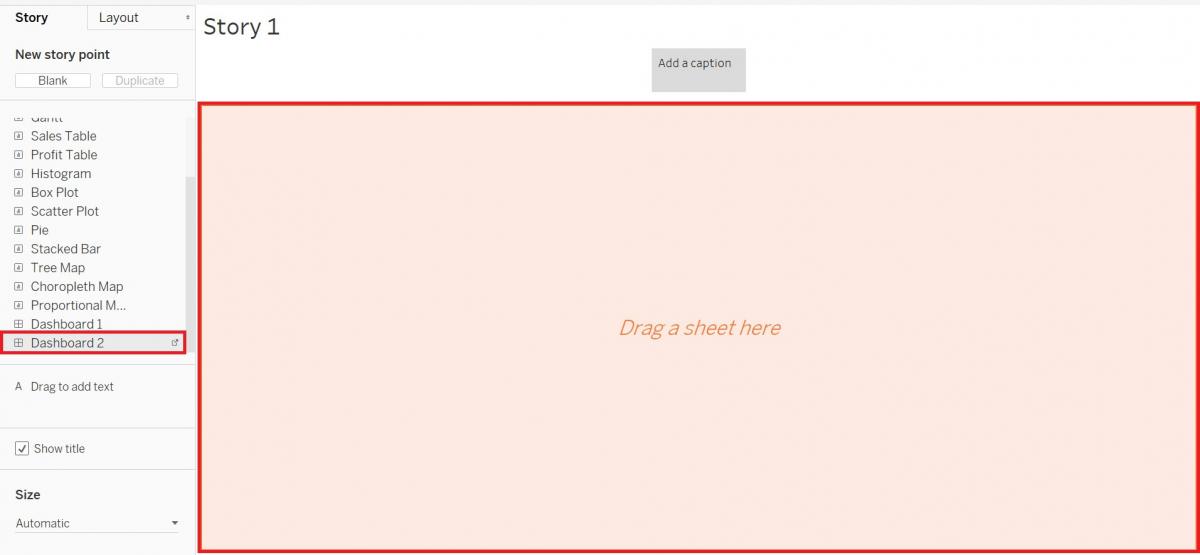
Now let’s create a new story. Click on the new story icon – the far right icon at the bottom, next to the new dashboard icon.
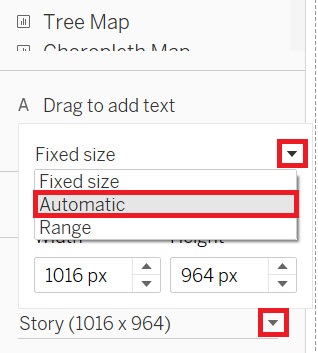
Change the size on the bottom right to Automatic.
Drag in Dashboard 2.
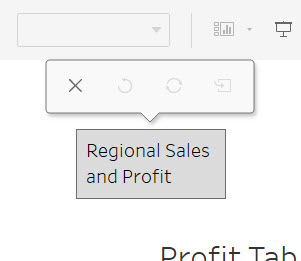
Click on the grey box at the top to add a caption. Put “Regional Sales and Profit”.
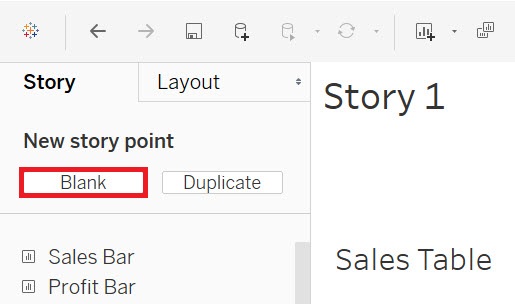
Click on blank under New story point on the top left.
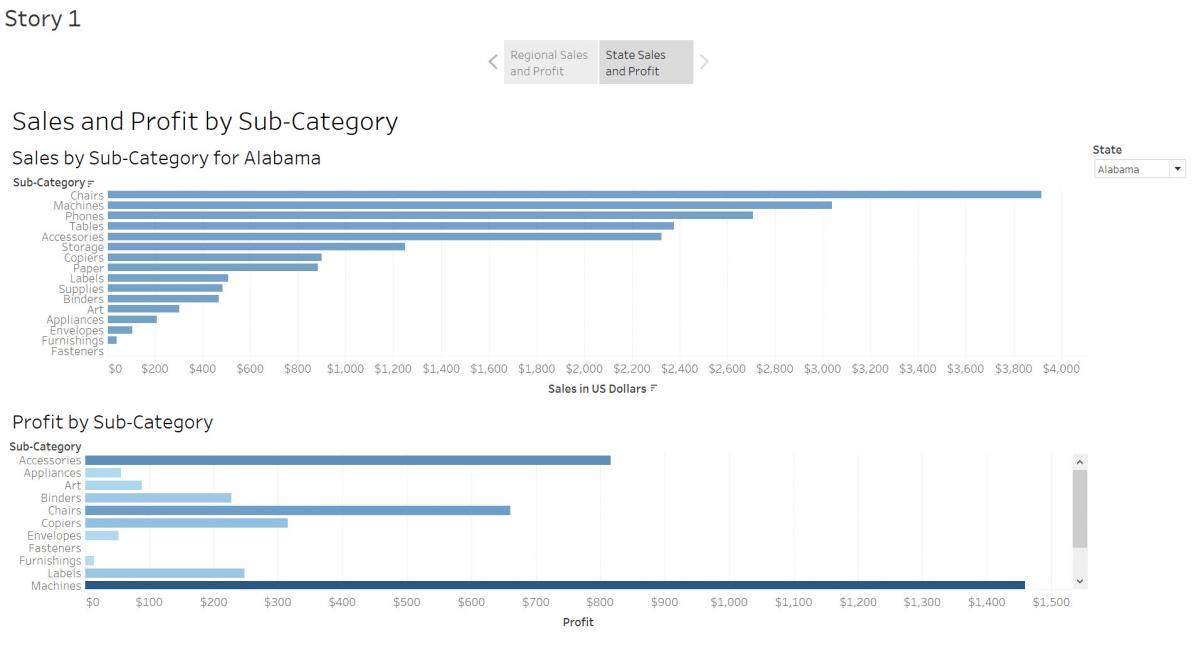
Drag in Dashboard 1. Click on the grey box at the top to add a caption. Put “State Sales and Profit”.
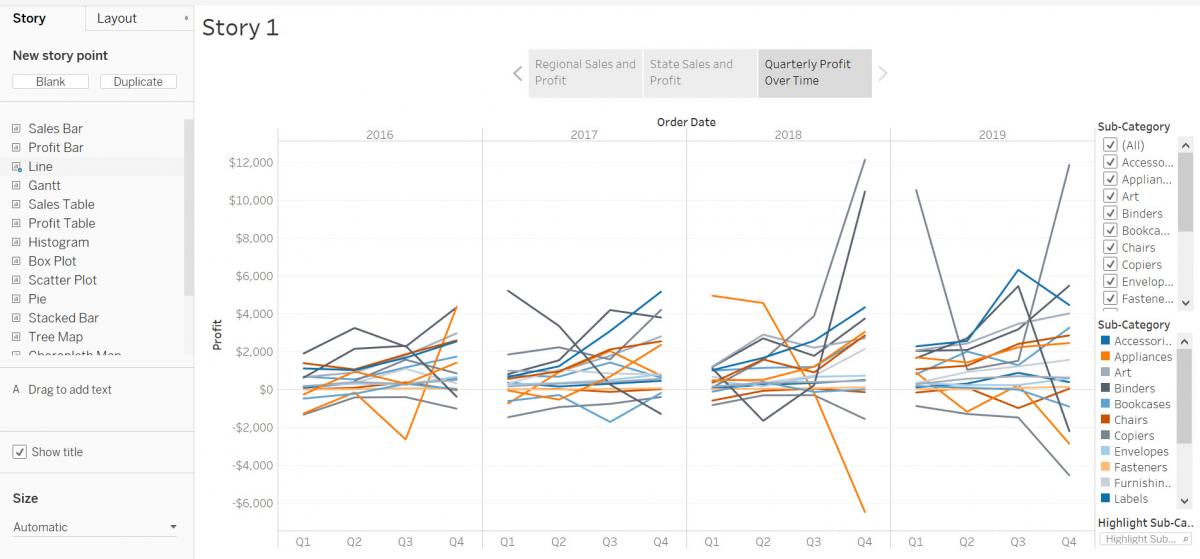
Finally, you do not need to only use dashboards in stories. You can also use individual sheets, and mix and match as you want, so click on blank under New story point again, and drag in the Line sheet. Click on the grey box at the top to add a caption. Put “Quarterly Profit Over Time”.
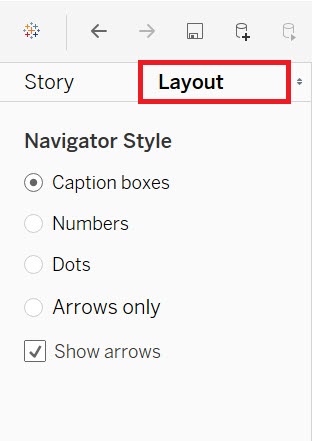
You can resize the caption squares, if you need to. If you want to edit how the caption squares look, click on the Layout tab on the top left for more options to try.
To view the finished story (or dashboard or worksheet), press F7 to get into presentation mode. If we try that now for our story, you can see how a reader can use the arrow keys to move through the tabs of the story, or select a particular tab to jump to that page. Press Esc to exit.
Once you have created some visualizations, dashboards, and stories, your last steps are to save and publish them. If you are working on some visualizations, as we have here, you can save work-in-progress as a Tableau Workbook file. Go to the File menu and click on Save. Give it a name and select where you want to save the file. (Note: If you do this, it does not save the underlying data, so you have keep the data file(s) and workbook together). Or you can select Export Packaged Workbook… (also from the File menu). Then you could share that file with others who have Tableau (and this time it includes the data). In both cases, you can then come back to revisit your work later by reopening it in Tableau Desktop.
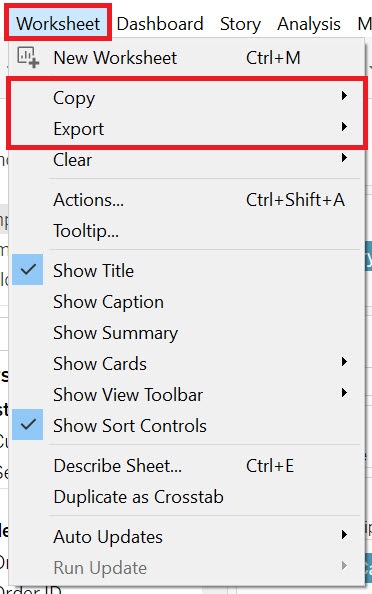
If you want to export one of your worksheets to an image you can use in a report or article, you can do so from the Worksheet menu. There are options to either export it as an image or copy it and paste it into a document or image editing software to work with it further. You can do the same thing for your whole Dashboard or Story from the Dashboard or Story menu respectively.
Note: As our dashboard, stories, and visualizations can also be interactive, there may be times when you want to publish them to the web so that your users can view them. Your free option is to create a Tableau Public (https://public.tableau.com/en-us/s/) account and publish it there using that option in the Server menu (but note it is public; however, you can adjust the settings, if you do not want readers to download the underlying data and/or workbook). There are also pay options (Tableau Online: https://www.tableau.com/products/cloud-bi and Tableau Server: https://www.tableau.com/products/server), if you want to be able to limit permissions on who can view your visualizations or to publish to your own server; use the Publish Workbook option from the Server menu to access these options.
And that’s it! If you need more help using Tableau there are links in the Data Viz Guide to Tableau’s online tutorials to help you go further: https://mdl.library.utoronto.ca/dataviz/tools-tutorials#generalvisualizationtools
Technique: Data Visualization | Tools: Tableau