Creating Stacked Bar Graphs
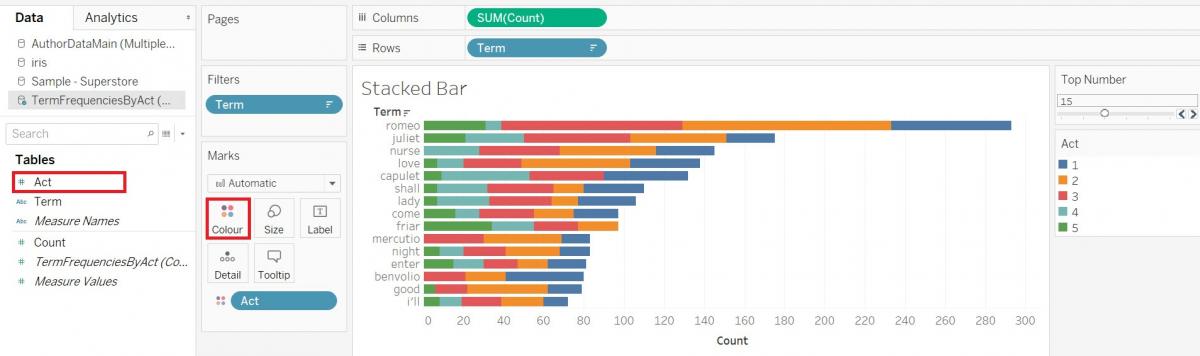
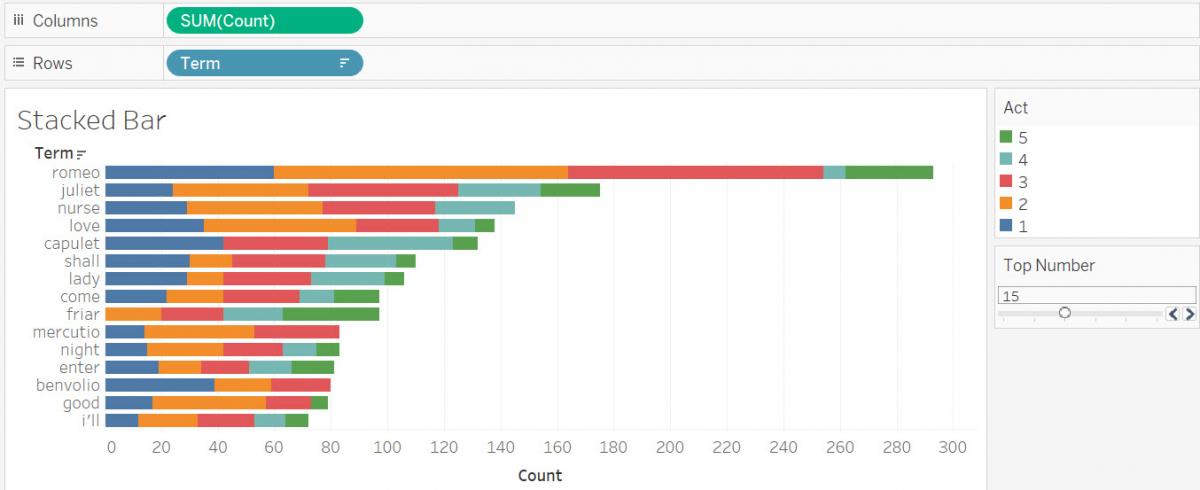
Let’s create one more visualization with this dataset to look at the words used in more details – a stacked bar graph. Not only can we use this visualization to show totals and rank categories by those totals, similar to a bar graph, but it can also show the breakdown or composition of these totals. In our specific example, let’s create a stacked bar graph of the most frequent words in the play by act.
Again, we need a new worksheet. Click on the new worksheet icon at the bottom of the screen. Let’s rename this one to “Stacked Bar”.
Next, hold down the Ctrl key and select the Term variable (Dimensions) and the Count variable (Measures), then click on Show Me, and select the recommended horizontal bar graph.
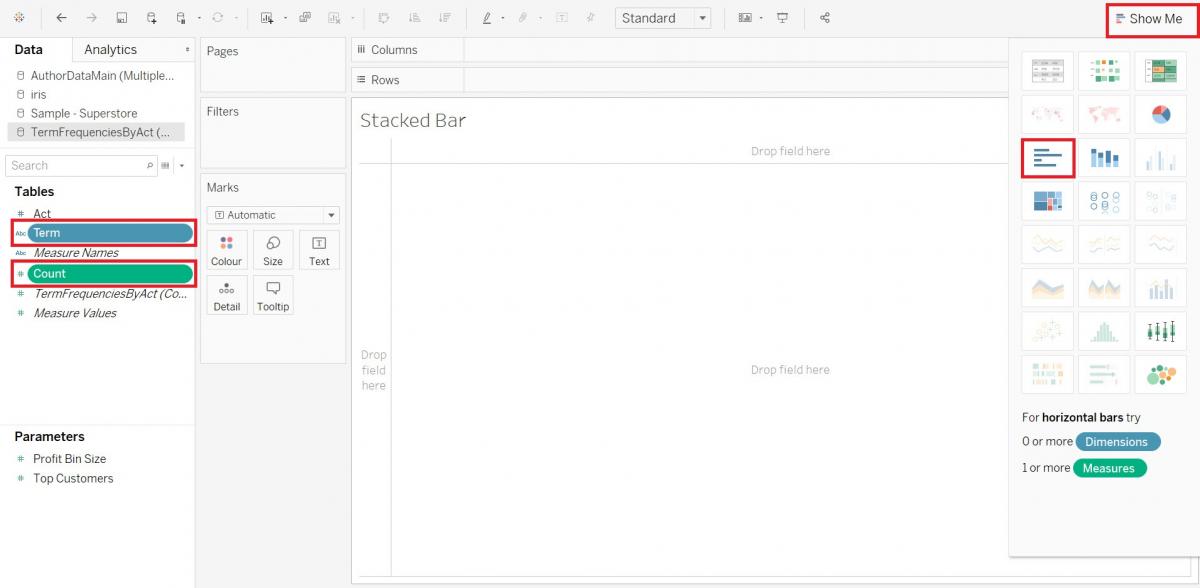
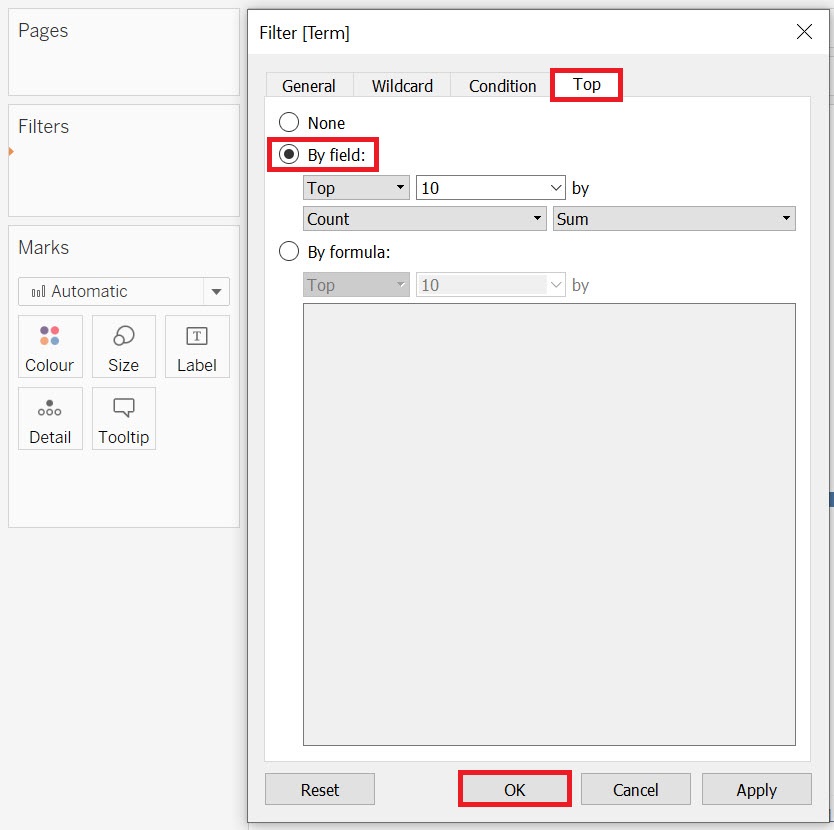
As you can see, there are many terms listed there. Let’s filter it so we’re only see the top 10 words mentioned. Drag the Term variable (Dimensions) to the Filters shelf. Go to the Top tab, and click By Field. By default, it is going to use the Count variable and sum up the instances to get the top 10. Keep the defaults and click OK.
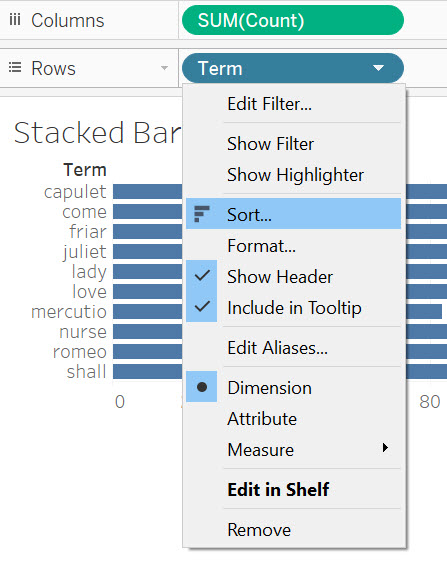
Now we have our top 10 terms, but in alphabetical order by term. It might be nicer to sort them by count. Right clicking on the Term pill in the Rows section, and select Sort.
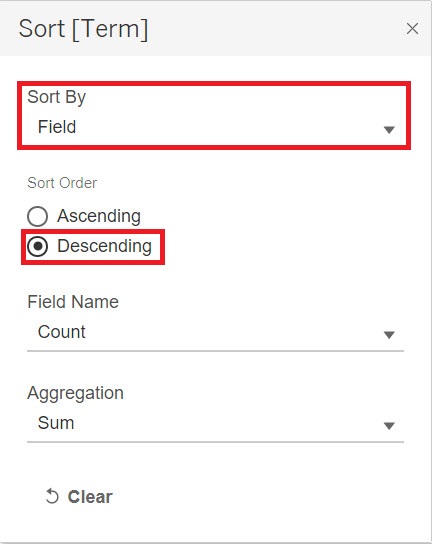
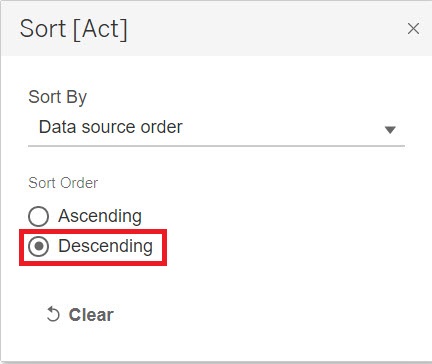
In the Sort By drop-down, select Field and leave the defaults, as it is using the sum of count. Select Descending, and then close the window to get the most cited term first.
Now we would like to add the Act information to make a colour-coded stacked bar graph. It is a category, so it makes sense to visualize it through colour. So drag the Act variable (Dimensions) onto the Colour box on the Marks card.
Looking better, but it seems to be backwards. We can fix that. Right click on the Act pill and select Sort.
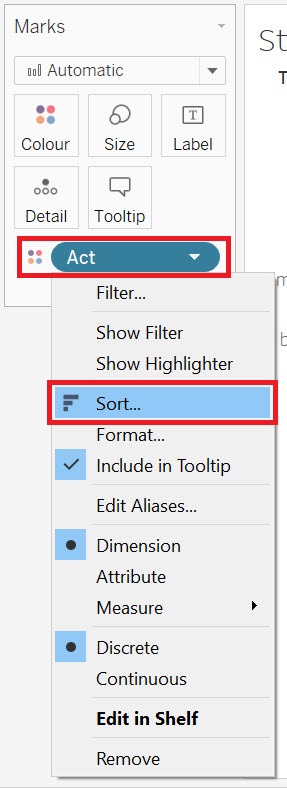
Select Descending and then click on ok.
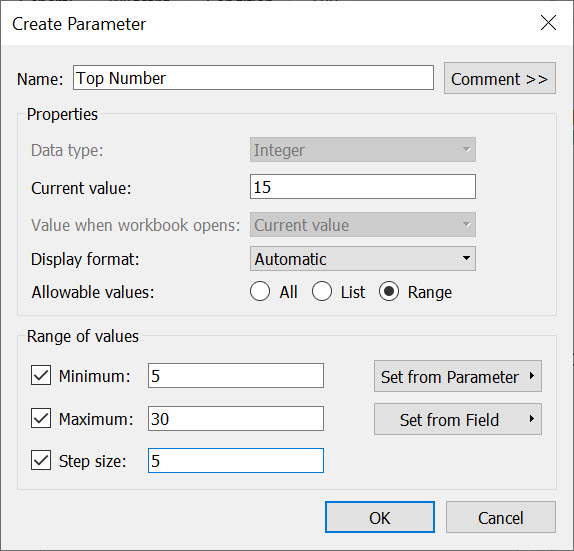
So now we have our top 10 terms, subdivided by Act; however, what if our audience would rather just see top 5 terms, or would like to expand it out to top 20 or 30 terms. We can get an audience’s input into our visualizations using parameters. Right click on the Term pill in the Filters shelf, and select Edit Filter… Go to the Top tab and click on the drop-down arrow next to where 10 is specified. Select Create a New Parameter…
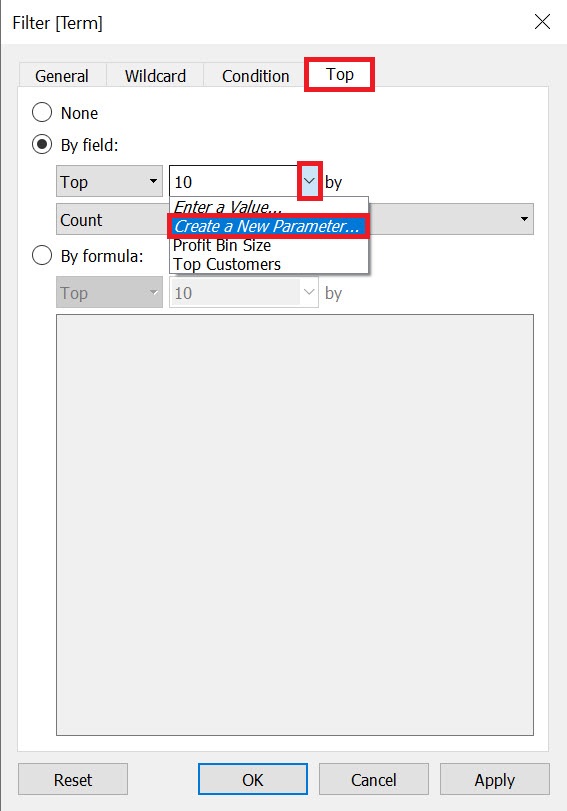
Give it a name, such as Top Number. Go down to the Range of Values section. Set the minimum to 5, the maximum to 30, and the step size to 5. Then click on OK, and click OK again on the Filter window.
Your Top Number parameter should show up on the left side, under your variables. Right click on it, and select Show Parameter.
Now you should see a control on the right that your audience can use to adjust how many terms to see in their top terms list.
Technique: Data Visualization | Tools: Tableau