Code Line
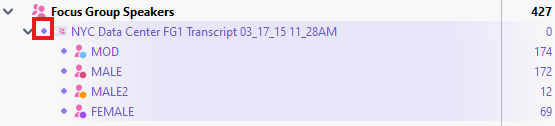
Finally, a visual tool that can help you analyze focus groups is Code Line. Activate all the Focus Group Speaker Codes for the Focus Group transcript we have been working with from the Code System panel by clicking on the circle to the right of the focus group document name below Focus Group Speakers.
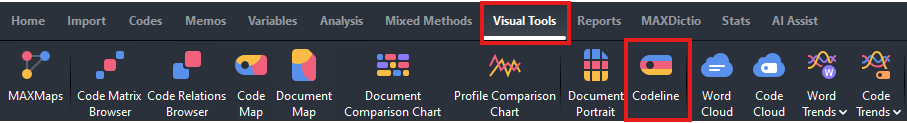
- Go to the Visual Tools menu and select Codeline.
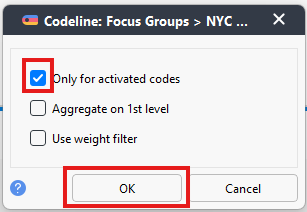
Make sure that Only for activated codes is selected.
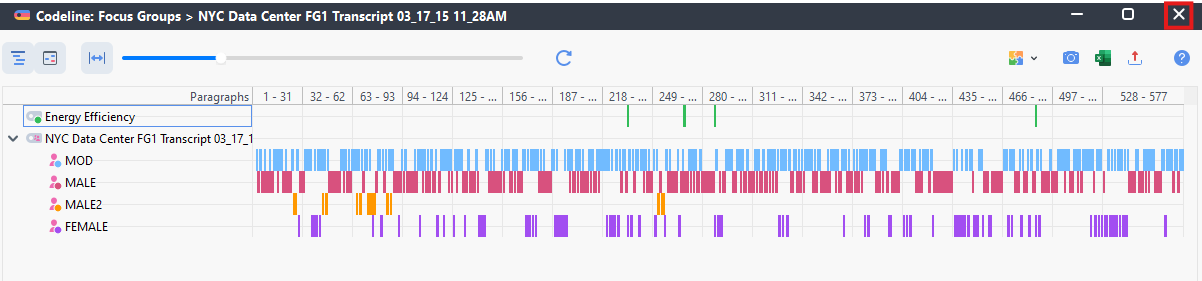
- Here is a visual showing how each participant contributed to the conversation. Click on the standardize unit width icon (second from the left) and, to view the whole document in the window, click on the Fit to Window Width icon (looks like a double-headed arrow) at the top.
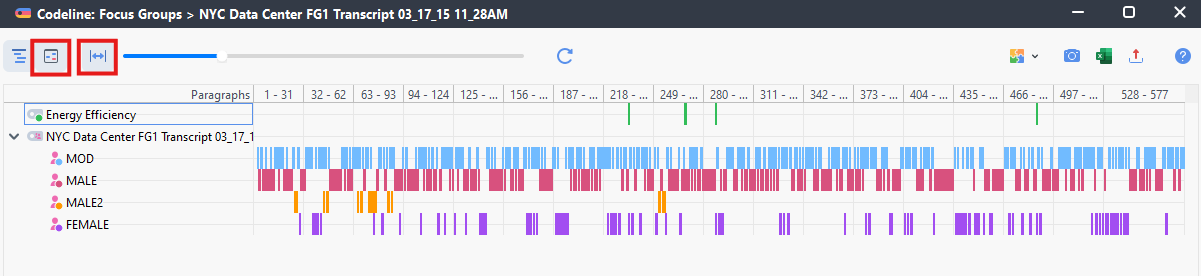
- It gives you an interesting overview of how the focus group went. Here you can see for example that MALE2 did not contribute much to the conversation, while MALE seems to have dominated it.
- You can learn more in the MAXQDA manual, Analyzing Focus Group Data Section.
- Let’s close up that window now and move on to our second topic.
Technique: Qualitative Data Analysis | Tools: MAXQDA