Segment Matrix
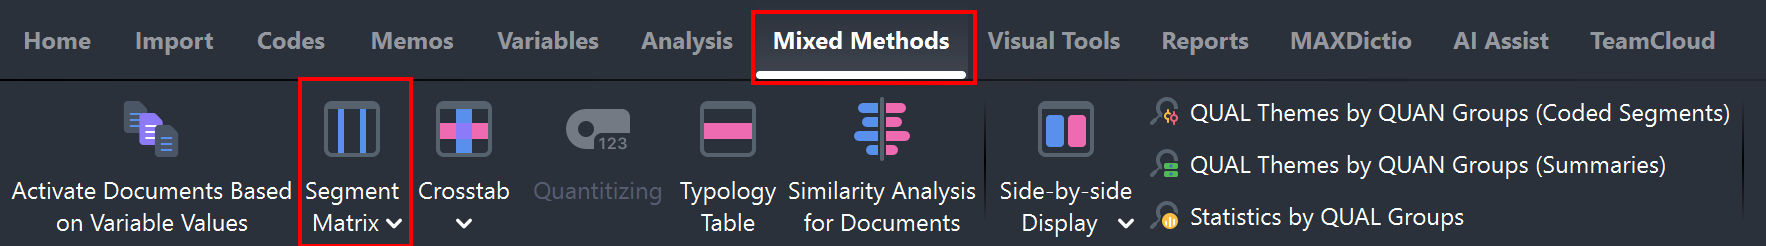
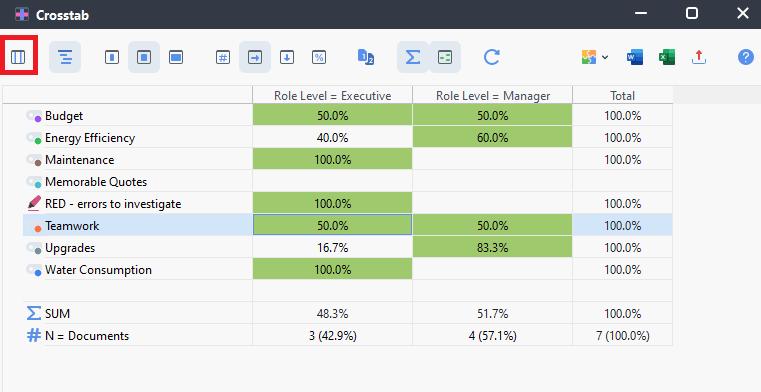
From the Crosstab, we can also move to a related analysis tool called Segment Matrix. This tool can be selected from the Mixed Methods menu, but if we want to keep the same codes and variables, we can just go to it from the Crosstab display by clicking on the far left icon, called Segment Matrix.
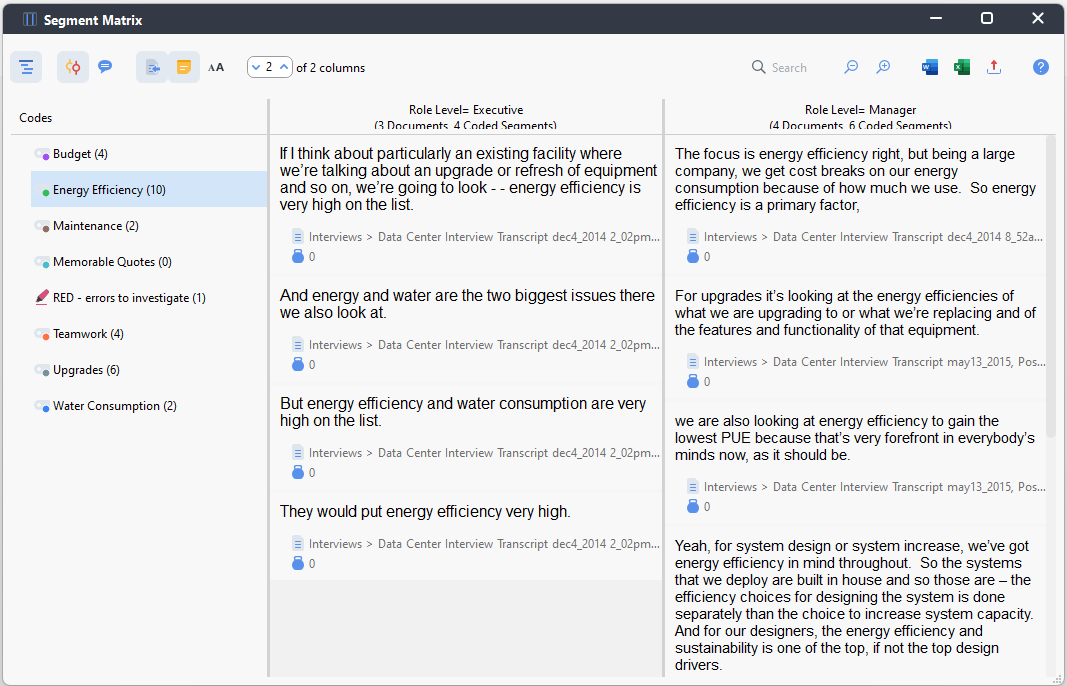
- Our codes are now listed on the left and the first code is highlighted. The columns on the right pertain to the variable values we’ve selected from the Crosstab. Underneath it displays all the segments that intersect with that code and variable value, and you can compare them between the variable values for a particular code. You can select the different codes in the list to view those appropriate segments. A great way to compare your data.
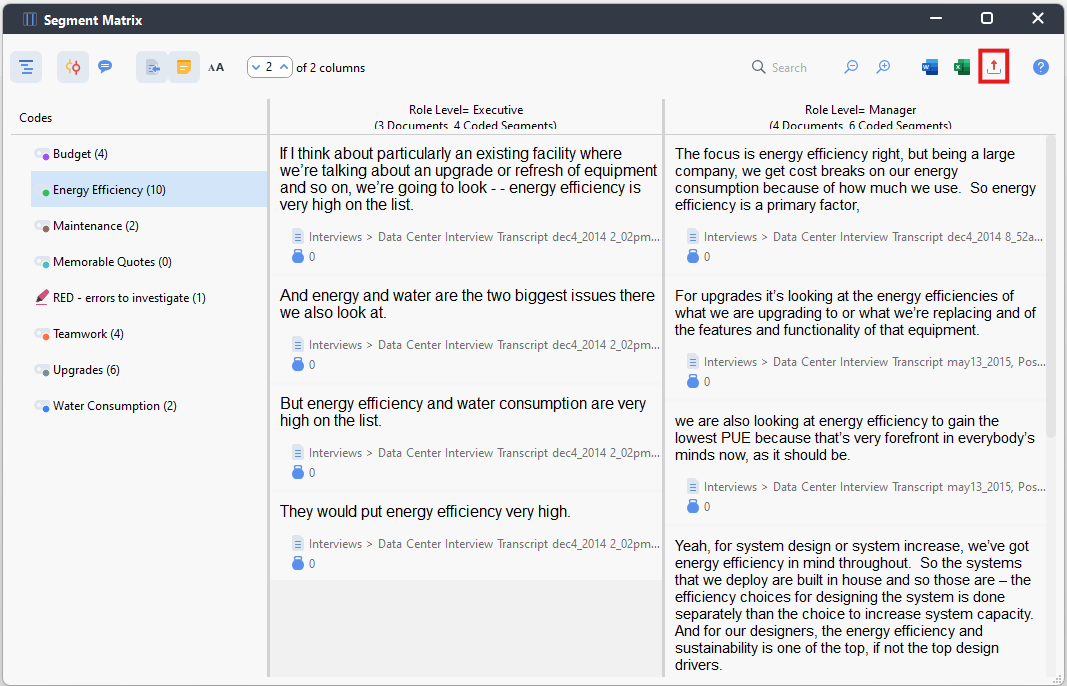
- You can use the export icon to export this as a Word or Excel file.
Technique: Qualitative Data Analysis | Tools: MAXQDA