Code Matrix Browser
With our Berlin interview documents activated, let’s look at another visual called the Code Matrix Browser. This compares documents to codes. We have our documents activated, but this time, let’s also activate some codes.
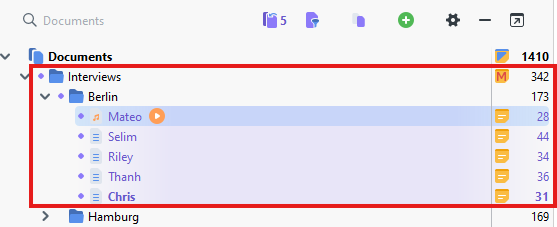
Go to the Code System panel and activate all the Daily activities codes by clicking on the circle to the left of Daily activities. You can expand the code to verify that all the child codes have also been activated.

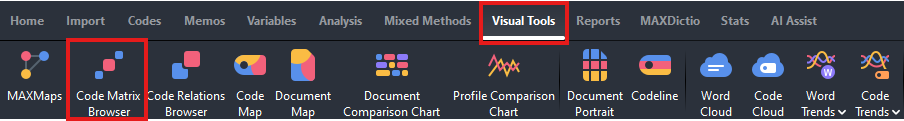
- Go to the Visual Tools menu and select Code Matrix Browser.
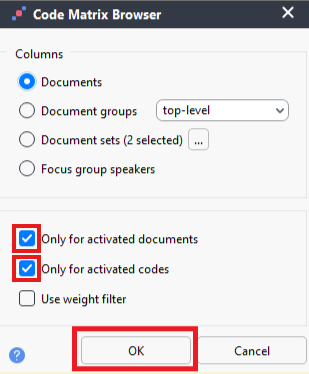
Make sure that Only for activated documents and Only for activated codes are both selected. Click on OK.
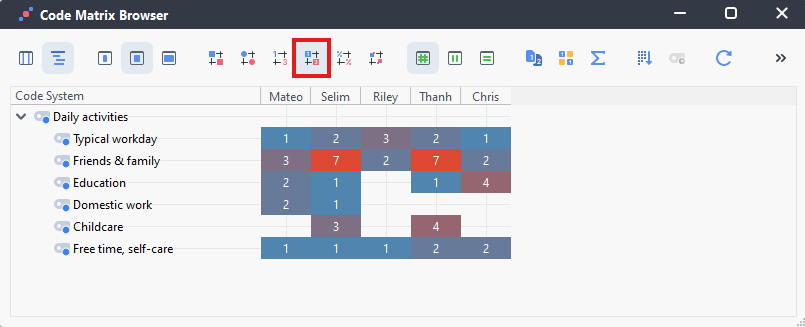
Here we are presented with a grid where the documents are along the columns, the rows are our codes, and the cells show as different sized squares to represent the number of coded segments that are coded with a particular code from that particular document. The larger the square, the larger the number. This can show you the most frequent codes used in particular documents.
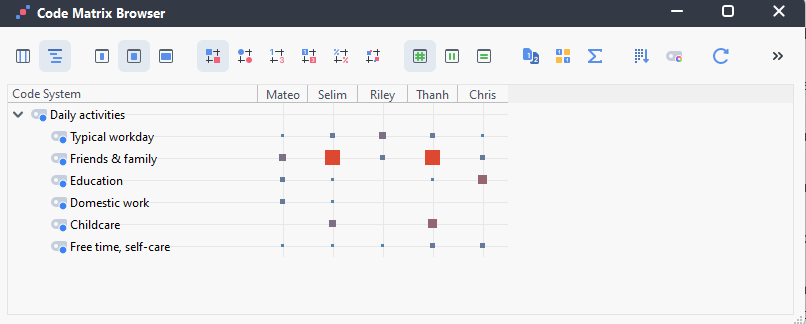
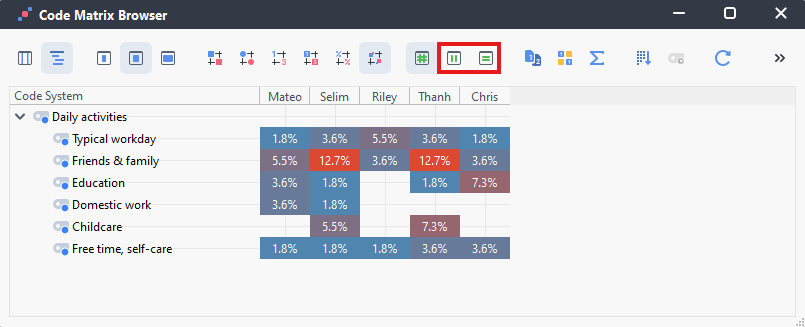
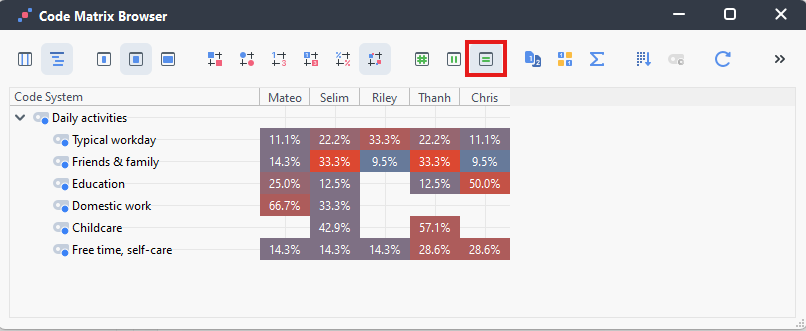
We can change the squares into shaded numbers instead by selecting the Frequencies (heatmap) option from the second drop-down menu at the top.
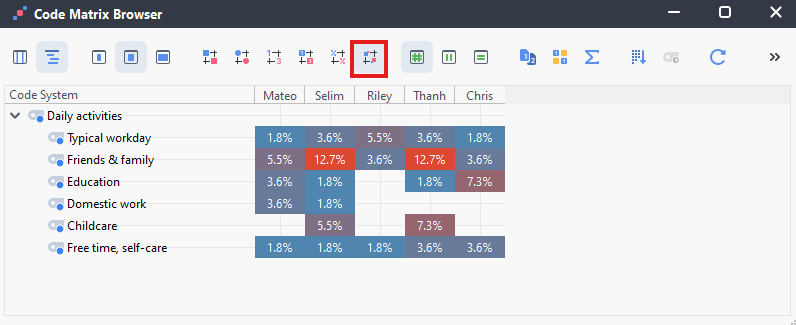
We can also change it from numbers to percentages by selecting the Percentages (heatmap) option from the second drop-down menu at the top.
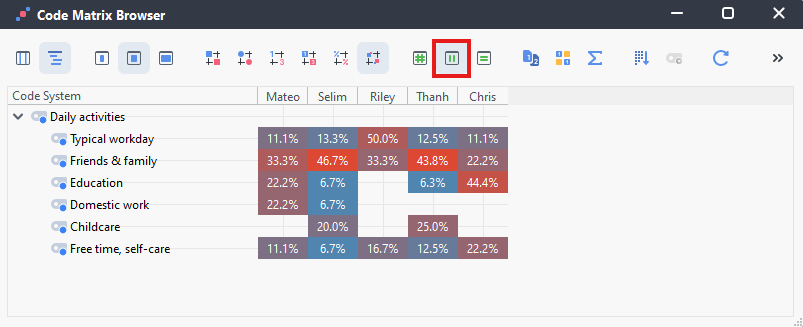
Similar to the Crosstab we created earlier, we can change it to calculate column percentages or row percentages by selecting Node size, color, percentages based on: column or row from the third drop-down menu at the top. Column percentages will show the percentage of all coded segments in a document and how they map to the codes. Row percentages will show you the percentage of all segments in a code and how they map to each document.
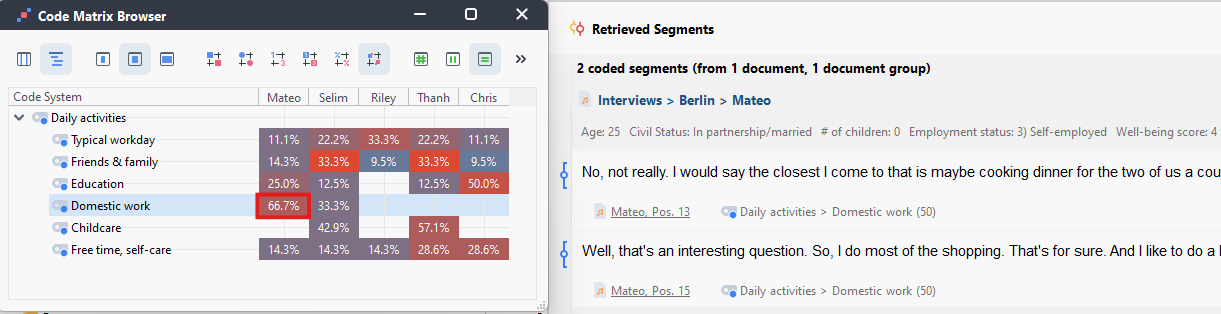
- As with Crosstabs, if you double click on any cell, it will bring up those segments (at that intersection of code and document) in the Retrieved Segments window.
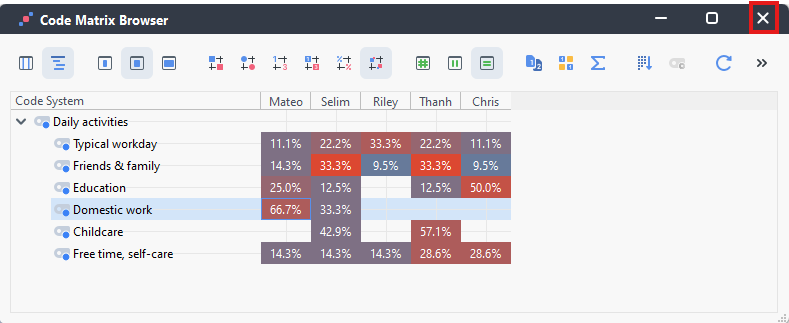
- And finally, again, we can export this, if we wanted. For now, let’s close the window.
Technique: Qualitative Data Analysis | Tools: MAXQDA