Document Portrait
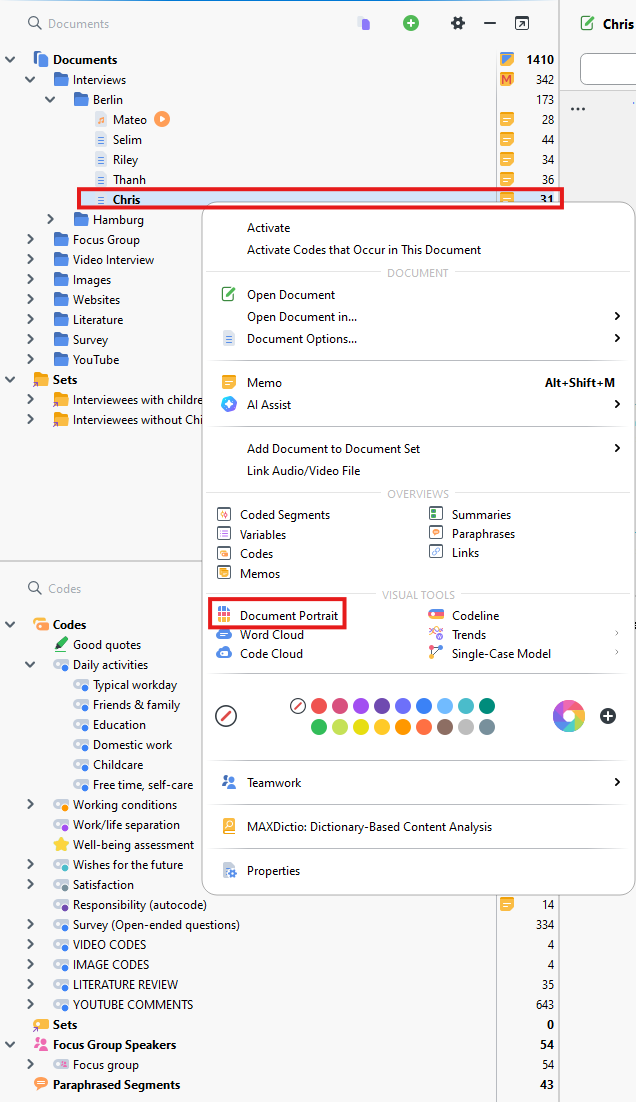
- For now, the first the visual to take a look at is the document portrait. This gives you a sense of how much coding you’ve done in a document, what codes dominate and where, etc.
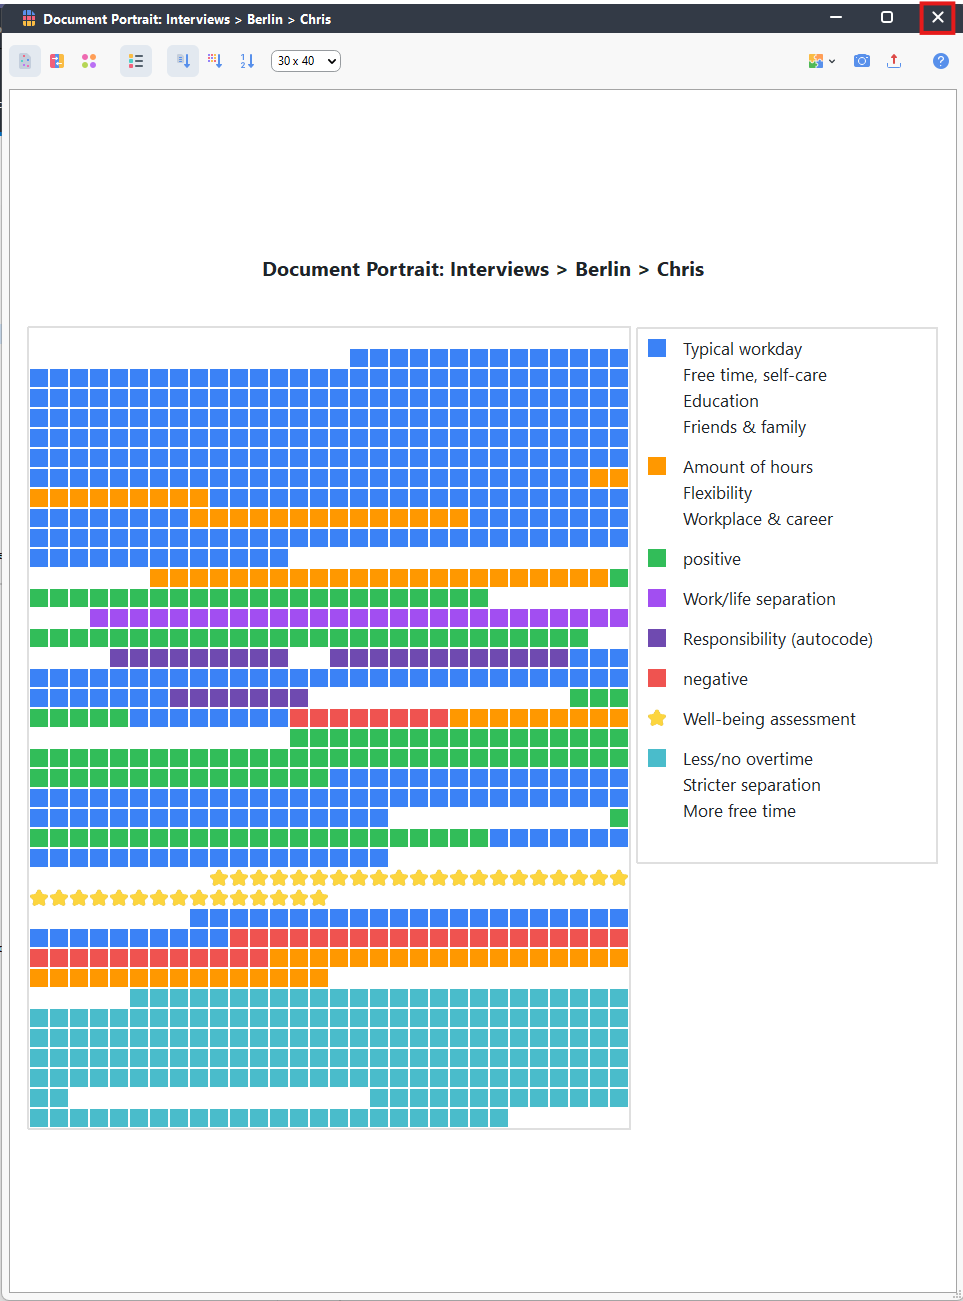
Expand the Interviews folder, and then expand the Berlin folder, and right click on Chris. Select Document Portrait. The coloured squares represent how much coding of the different coloured codes have been applied to this document and in what order.
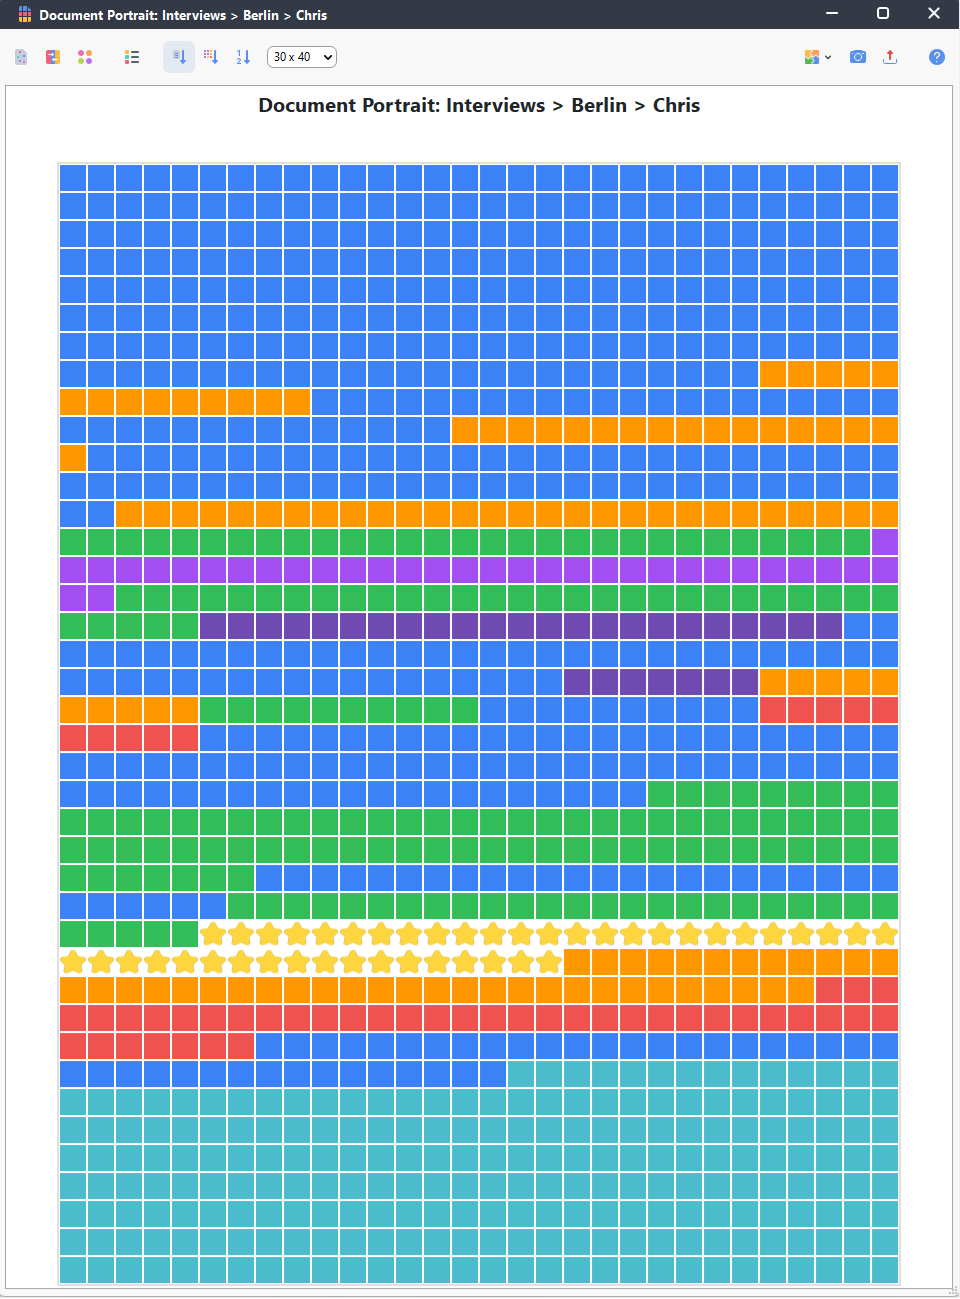
- As we aren’t too familiar yet with the codes in this project, you can turn on a legend by clicking on the legend icon at the top (looks like 3 coloured boxes with lines next to them). We can see for example that there are more positive than negative statements in this interview.
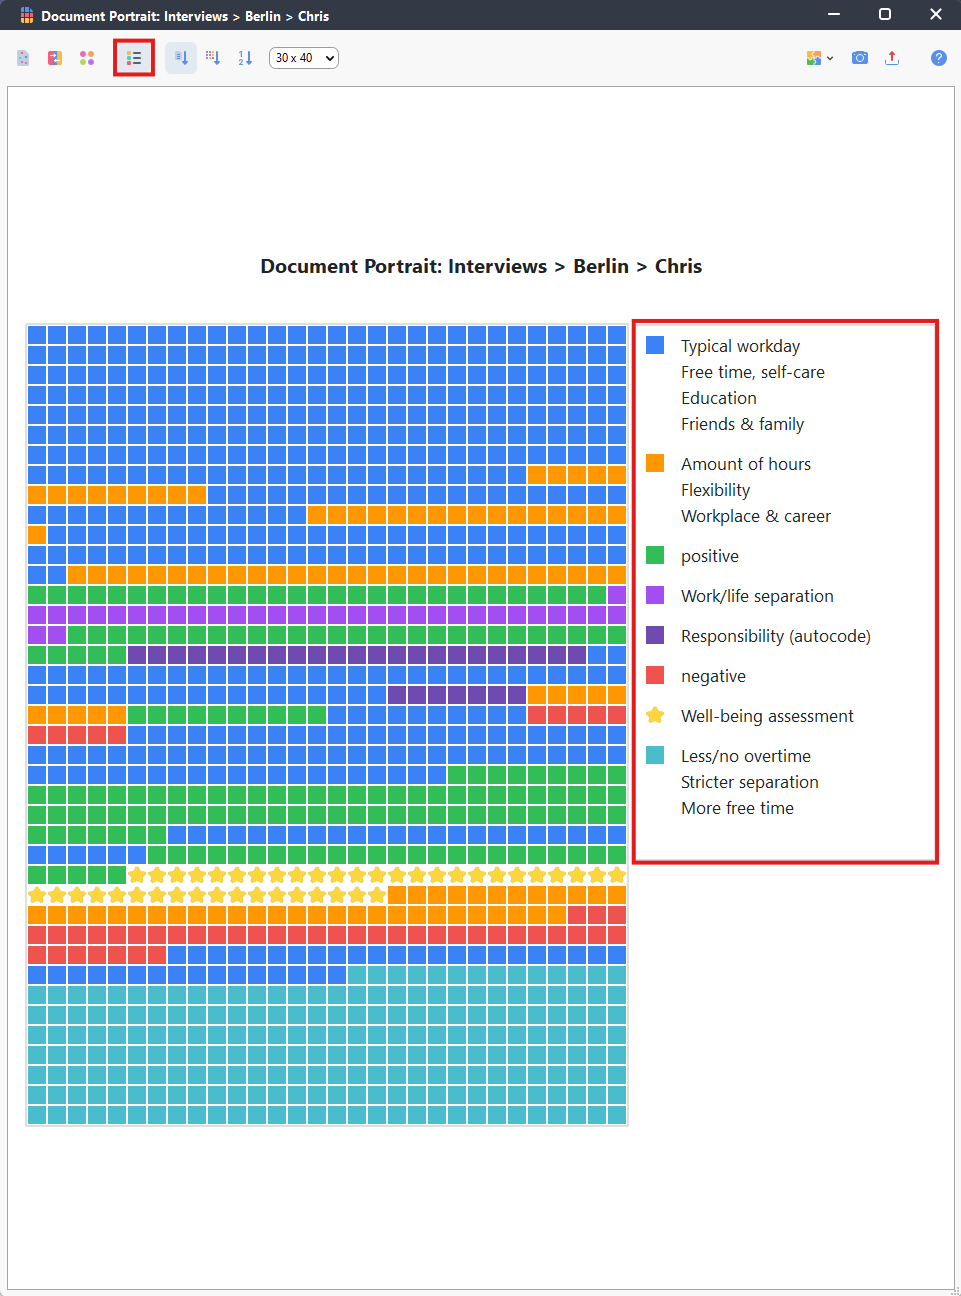
Currently it is just showing the code colours continuously, but we can the visualize entire document by clicking on the icon at the top left to see gaps where no coding has been done. This can give us a sense of how complete our coding is on this document.
- Just like with other analyses or visuals, we can export this, if we wanted. For now, let’s close the window.
Technique: Qualitative Data Analysis | Tools: MAXQDA