Visuals - Introduction
MAXQDA is really strong in its visual tools. We won’t be able to look at all of them today, but I’ll show you a few to get started. A lot of the visuals will use your code colours, so generally make sure that you assign colours that make sense to you.
- For this part of the workshop, we’re going to look at one of the example projects so that we have more data to visualize.
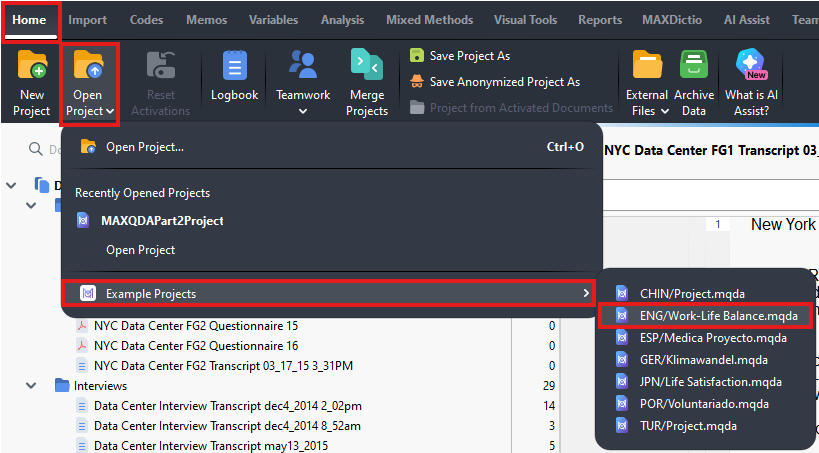
Go to the Home menu and select Open Project. Hover over Example Projects and select ENG/Work Life Balance.mqda. This is a complex project that includes interviews, focus groups, images, survey data, and more. I encourage you to explore this project on your own time later to learn more about MAXQDA.
Technique: Qualitative Data Analysis | Tools: MAXQDA